Uncategorized
The January lull in prepayment speeds won’t last
admin | February 7, 2020
This material is a Marketing Communication and does not constitute Independent Investment Research.
January speeds often surprise to the slow side, and the start to 2020 to was no exception. Ginnie Mae speeds slowed less than those of conventional 30-years, slightly widening the prepayment gap which has opened over the past few months. However, interest rates have fallen once again, and low WALA Ginnie Mae pools may offer the best protection from the faster prepayment speeds coming in February and March.
Fannie Mae and Freddie Mac 30-year prepayment speeds dropped 14% in January, a little more than expected. Lagged mortgage rates were roughly unchanged and there were an additional 1.5 business days, which should have prevented speeds from falling as much as they did.
Ginnie Mae speeds also slowed, but not by as much as conventionals. For the last few months Ginnie Mae MBS have widened their prepayment gap with conventionals. Many FHA and VA borrowers are finally becoming eligible for government refinance programs, pushing speeds faster. But Ginnie Mae MBS have strong prepayment protection at low WALAs, even better than low WALA conventional MBS. Therefore low WALA Ginnie Mae pools may be a good way to find shelter from the faster prepayment speeds expected in February and March.
Exhibit 1: Speeds slow in January, especially conventionals
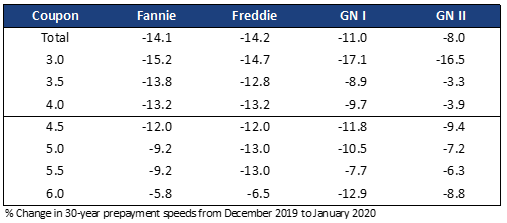
Source: Fannie Mae, Freddie Mac, Ginnie Mae, eMBS, Amherst Pierpont Securities
Looking ahead
Interest rates have fallen again and mortgage rates are lower than at any point during 2019. Therefore prepayment speeds are set to accelerate. Lagged mortgage rates are about 12 basis points lower in February than January, which should push prepayment speeds 5 to 10% faster despite fewer business days. And if interest rates remain near current levels prepayment speeds should explode in March. A longer month, faster housing turnover, and most importantly an additional 15 basis point drop in lagged mortgage rates could push prepayment speeds 40 to 45% faster. This would be similar to October 2019, the fastest month last year.
The MBA refinance index confirms faster speeds are pending
The forecast for faster speeds is evident in the MBA refinance index (Exhibit 2). The index is almost 50% higher than levels from early December and has surpassed the peak level of 2019. Interestingly, most of the gain came from the conventional index, substantially narrowing the gap to the government index.
Exhibit 2: MBA Refinance Index
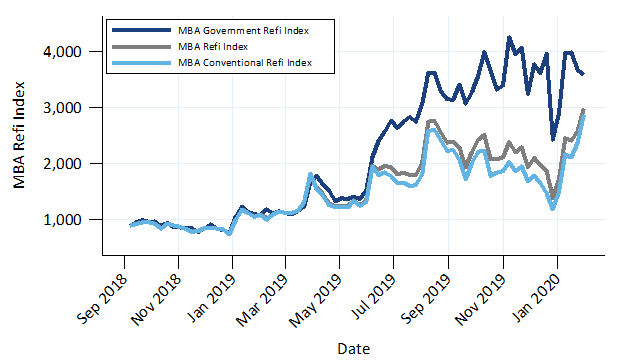
Source: Bloomberg, Amherst Pierpont Securities
Faster conventional prepayment speeds could cause the Ginnie Mae TBA to strengthen relative to conventionals. Fear of faster government prepayments has caused Ginnie Mae TBA to significantly underperform conventional TBA over the past few weeks. But the MBA refinance index suggests that conventional speeds could increase more than Ginnie Mae speeds.
Ginnie Mae pools also offer better low WALA prepayment protection than conventional pools, since the FHA and VA are in a stronger position to prohibit low WALA refinancing than conventional lenders and the GSEs. Low WALA Ginnie Mae pools may be an inexpensive source of near-term prepayment protection, and if interest rates increase before the borrowers become refinanceable then fast speeds may never materialize. This topic is discussed in detail here.
The Fannie Mae and Freddie Mac numbers
Fannie Mae and Freddie Mac prepayment speeds both slowed 14% in January. Speeds slowed pretty consistently across the stack, but most of the decline came in moderately seasoned and seasoned vintages. 2018 and 2019 production either didn’t slow nearly as much as older vintages. One cohort—Fannie Mae 3.0%s 2019—actually increased 6.5% to 6.5 CPR from 6.1 CPR.
Strong prints in 2019 Ginnie Mae MBS
Overall Ginnie Mae prepayment speeds did not slow as much as conventionals. For example, Ginnie Mae II prepayment speeds slowed only 8%. But most cohorts slowed roughly 10 to 15%, in-line with conventionals. The 2019 vintage was the exception—as borrowers become eligible for refinancing these speeds increase dramatically. For example, the 3.0%s 2019 increased 75.9% to 4.0 CPR from 2.3 CPR—a massive increase compared to the gain on the same Fannie Mae cohort, although absolute speeds have not yet caught up to Fannie.
A second example are Ginnie Mae II 3.5%s, which increased 56.7% to 23.8 CPR from 15.9 CPR. This cohort prepaid 1.8 CPR slower than the same conventional cohort in December but prepaid 6.7 CPR faster in January.
Data Tables
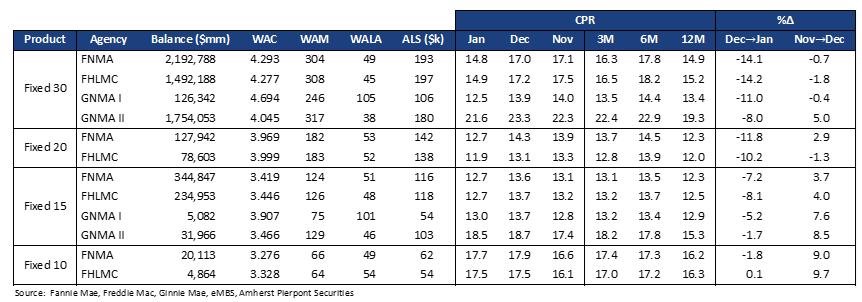
Exhibit 3: Prepayment Summary
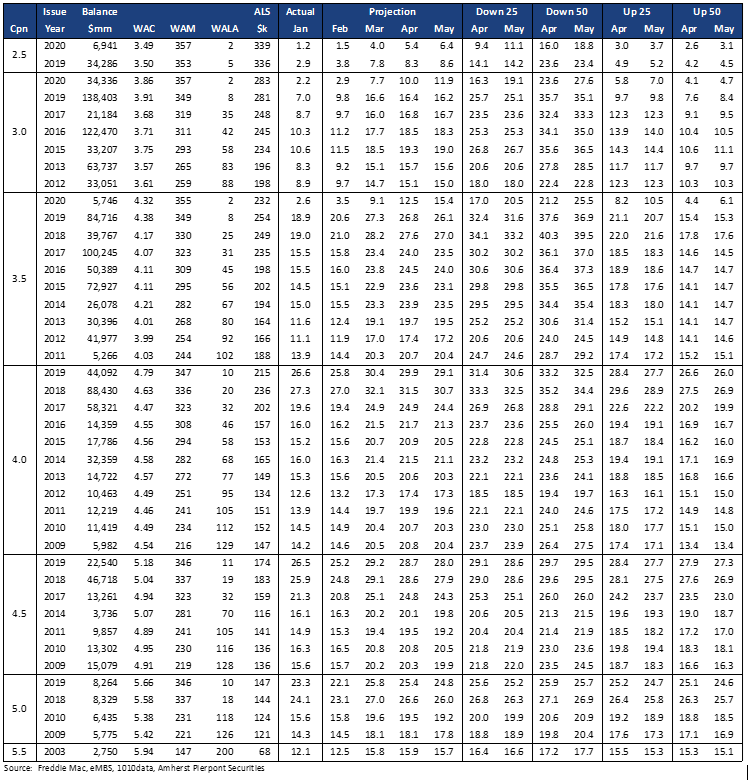
Our short term forecast is shown in Exhibit 6 (Fannie Mae) and Exhibit 7 (Freddie Mac). Exhibit 5 shows the static rates used in the prepayment forecast.
Exhibit 4: Agency Speeds, Largest Cohorts
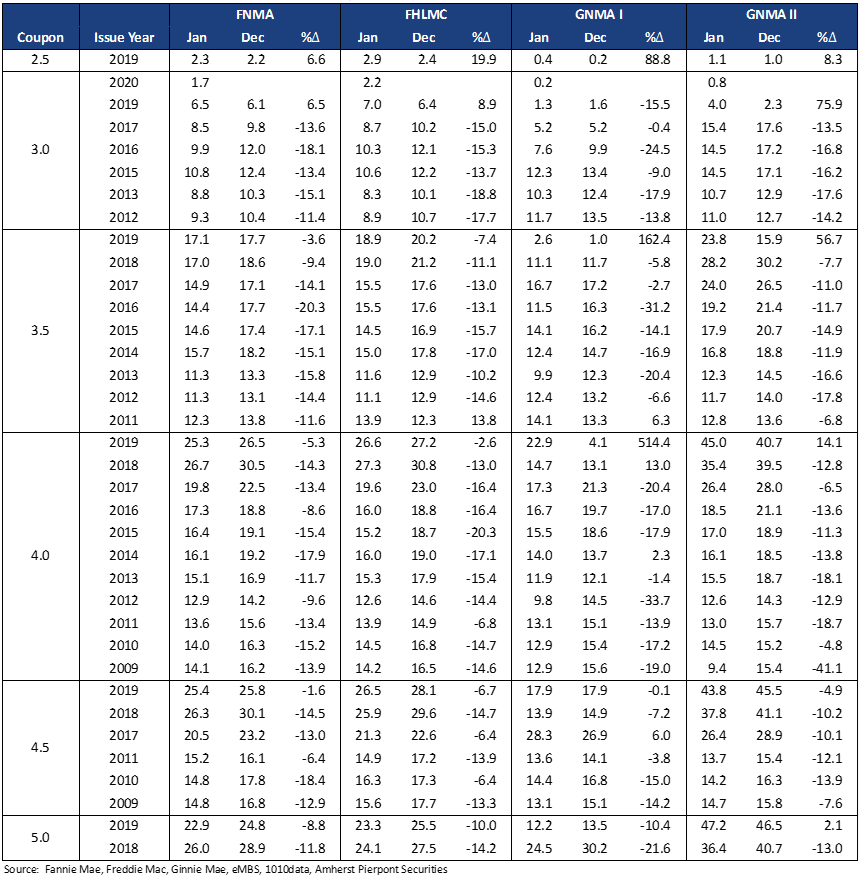
Exhibit 5: Mortgage Rate Forecast
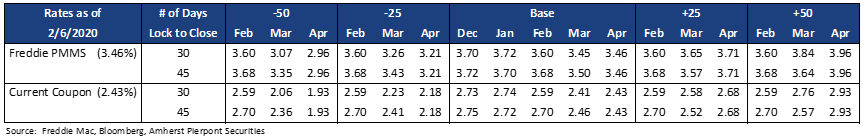
Exhibit 6: Fannie Mae Short Term Forecast
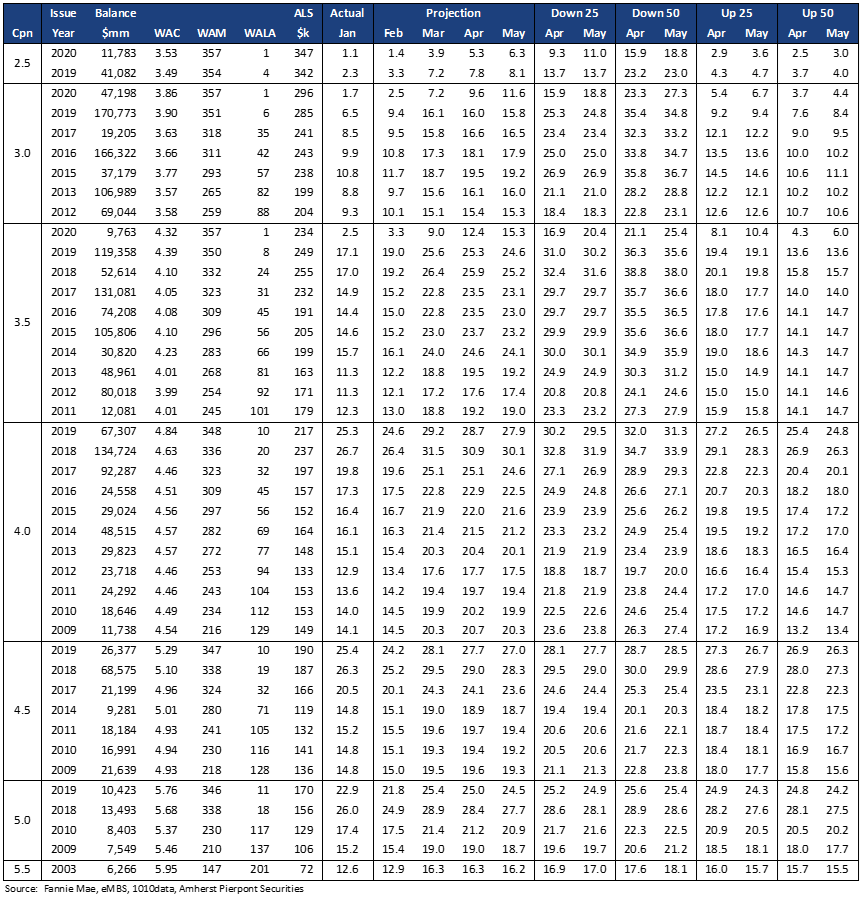
Exhibit 7: Freddie Mac Short Term Forecast
This material is intended only for institutional investors and does not carry all of the independence and disclosure standards of retail debt research reports. In the preparation of this material, the author may have consulted or otherwise discussed the matters referenced herein with one or more of SCM’s trading desks, any of which may have accumulated or otherwise taken a position, long or short, in any of the financial instruments discussed in or related to this material. Further, SCM may act as a market maker or principal dealer and may have proprietary interests that differ or conflict with the recipient hereof, in connection with any financial instrument discussed in or related to this material.
This message, including any attachments or links contained herein, is subject to important disclaimers, conditions, and disclosures regarding Electronic Communications, which you can find at https://portfolio-strategy.apsec.com/sancap-disclaimers-and-disclosures.
Important Disclaimers
Copyright © 2026 Santander US Capital Markets LLC and its affiliates (“SCM”). All rights reserved. SCM is a member of FINRA and SIPC. This material is intended for limited distribution to institutions only and is not publicly available. Any unauthorized use or disclosure is prohibited.
In making this material available, SCM (i) is not providing any advice to the recipient, including, without limitation, any advice as to investment, legal, accounting, tax and financial matters, (ii) is not acting as an advisor or fiduciary in respect of the recipient, (iii) is not making any predictions or projections and (iv) intends that any recipient to which SCM has provided this material is an “institutional investor” (as defined under applicable law and regulation, including FINRA Rule 4512 and that this material will not be disseminated, in whole or part, to any third party by the recipient.
The author of this material is an economist, desk strategist or trader. In the preparation of this material, the author may have consulted or otherwise discussed the matters referenced herein with one or more of SCM’s trading desks, any of which may have accumulated or otherwise taken a position, long or short, in any of the financial instruments discussed in or related to this material. Further, SCM or any of its affiliates may act as a market maker or principal dealer and may have proprietary interests that differ or conflict with the recipient hereof, in connection with any financial instrument discussed in or related to this material.
This material (i) has been prepared for information purposes only and does not constitute a solicitation or an offer to buy or sell any securities, related investments or other financial instruments, (ii) is neither research, a “research report” as commonly understood under the securities laws and regulations promulgated thereunder nor the product of a research department, (iii) or parts thereof may have been obtained from various sources, the reliability of which has not been verified and cannot be guaranteed by SCM, (iv) should not be reproduced or disclosed to any other person, without SCM’s prior consent and (v) is not intended for distribution in any jurisdiction in which its distribution would be prohibited.
In connection with this material, SCM (i) makes no representation or warranties as to the appropriateness or reliance for use in any transaction or as to the permissibility or legality of any financial instrument in any jurisdiction, (ii) believes the information in this material to be reliable, has not independently verified such information and makes no representation, express or implied, with regard to the accuracy or completeness of such information, (iii) accepts no responsibility or liability as to any reliance placed, or investment decision made, on the basis of such information by the recipient and (iv) does not undertake, and disclaims any duty to undertake, to update or to revise the information contained in this material.
Unless otherwise stated, the views, opinions, forecasts, valuations, or estimates contained in this material are those solely of the author, as of the date of publication of this material, and are subject to change without notice. The recipient of this material should make an independent evaluation of this information and make such other investigations as the recipient considers necessary (including obtaining independent financial advice), before transacting in any financial market or instrument discussed in or related to this material.
Important disclaimers for clients in the EU and UK
This publication has been prepared by Trading Desk Strategists within the Sales and Trading functions of Santander US Capital Markets LLC (“SanCap”), the US registered broker-dealer of Santander Corporate & Investment Banking. This communication is distributed in the EEA by Banco Santander S.A., a credit institution registered in Spain and authorised and regulated by the Bank of Spain and the CNMV. Any EEA recipient of this communication that would like to affect any transaction in any security or issuer discussed herein should do so with Banco Santander S.A. or any of its affiliates (together “Santander”). This communication has been distributed in the UK by Banco Santander, S.A.’s London branch, authorised by the Bank of Spain and subject to regulatory oversight on certain matters by the Financial Conduct Authority (FCA) and the Prudential Regulation Authority (PRA).
The publication is intended for exclusive use for Professional Clients and Eligible Counterparties as defined by MiFID II and is not intended for use by retail customers or for any persons or entities in any jurisdictions or country where such distribution or use would be contrary to local law or regulation.
This material is not a product of Santander´s Research Team and does not constitute independent investment research. This is a marketing communication and may contain ¨investment recommendations¨ as defined by the Market Abuse Regulation 596/2014 ("MAR"). This publication has not been prepared in accordance with legal requirements designed to promote the independence of research and is not subject to any prohibition on dealing ahead of the dissemination of investment research. The author, date and time of the production of this publication are as indicated herein.
This publication does not constitute investment advice and may not be relied upon to form an investment decision, nor should it be construed as any offer to sell or issue or invitation to purchase, acquire or subscribe for any instruments referred herein. The publication has been prepared in good faith and based on information Santander considers reliable as of the date of publication, but Santander does not guarantee or represent, express or implied, that such information is accurate or complete. All estimates, forecasts and opinions are current as at the date of this publication and are subject to change without notice. Unless otherwise indicated, Santander does not intend to update this publication. The views and commentary in this publication may not be objective or independent of the interests of the Trading and Sales functions of Santander, who may be active participants in the markets, investments or strategies referred to herein and/or may receive compensation from investment banking and non-investment banking services from entities mentioned herein. Santander may trade as principal, make a market or hold positions in instruments (or related derivatives) and/or hold financial interest in entities discussed herein. Santander may provide market commentary or trading strategies to other clients or engage in transactions which may differ from views expressed herein. Santander may have acted upon the contents of this publication prior to you having received it.
This publication is intended for the exclusive use of the recipient and must not be reproduced, redistributed or transmitted, in whole or in part, without Santander’s consent. The recipient agrees to keep confidential at all times information contained herein.


