Uncategorized
Style today predicts style tomorrow
admin | January 24, 2020
This material is a Marketing Communication and does not constitute Independent Investment Research.
The leveraged loan attributes that get so much attention in the CLO market—price, spread, ratings factor and bid depth, among others—do turn out to paint a reliable picture of a manager’s portfolio style. A quick study of loan attributes across managers from the beginning of 2019 to the end shows a generally high correlation. Manager standing relative to peers at the beginning, in other words, generally predicts standing at the end. But some attributes predict better than others.
Investors usually check a handful of loan attributes for each CLO or CLO manager to get a view of portfolio risk. Since mangers have discretion to trade the portfolio during reinvestment, however, attributes today may not reflect attributes tomorrow.
To test the stability of key aspects of managers’ portfolios, Amherst Pierpont took a snapshot of the CLO loan portfolios of 113 managers on December 31, 2018 and again on December 31, 2019. The snapshot included the following:
- Manager AUM in broadly syndicated leveraged loans
- Manager active deal count
- Weighted average spread across all CLOs
- Weighted average rating factor
- Weighted average price
- Weighted average bid depth
- Diversity score
- Second liens as a percent of par
- ‘Caa1’ loans as a percent of par
- ‘CCC’ loans as a percent of par
- Defaulted loans as a percent of par
- Unpriced loans as a percent of par
If managers with high weighted average spread portfolios maintain high spreads and managers with low weighted average spread portfolios maintain low spreads, for instance, the correlation of weighted average spread over time should be high. If managers’ spread varies dramatically as portfolios trade and reinvest, however, correlation should be low.
In general, correlations from the end of 2018 to the end of 2019 look high (Exhibit 1). The correlations of nearly 1.00 for AUM and deal count just say that relatively bigger managers remain big a year later and smaller managers remain small. The strong correlations of nearly 0.90 for diversity score, bid depth and share of second liens also suggests managers stake out relative positions on these attributes and largely maintain them. As for spread, share of ‘Caa1’ and rating factor, correlations also are healthy around 0.80. Only for share of ‘CCC,’ share of unpriced loans and loan price do correlations suggest only modest predictability. And for share of default loans, the level at the end of 2018 predicted almost nothing about the level a year later.
Exhibit 1: Manager portfolio attributes showed high correlation through 2019
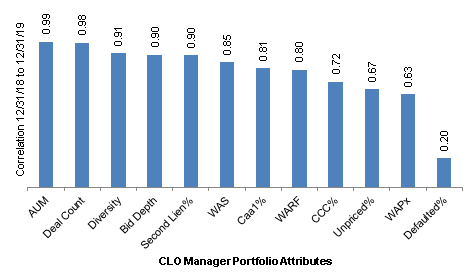
Source: Amherst Pierpont Securities
It’s encouraging that diversity score, weighted average spread and weighted average rating factor show strong correlation over time. Deal documents usually require managers to stay inside a set of limits defined by these attributes, and the strong correlations suggests managers do exactly that. But other attributes are telling, too. At least based on 2019, a manager today is very likely to look the same tomorrow.
This material is intended only for institutional investors and does not carry all of the independence and disclosure standards of retail debt research reports. In the preparation of this material, the author may have consulted or otherwise discussed the matters referenced herein with one or more of SCM’s trading desks, any of which may have accumulated or otherwise taken a position, long or short, in any of the financial instruments discussed in or related to this material. Further, SCM may act as a market maker or principal dealer and may have proprietary interests that differ or conflict with the recipient hereof, in connection with any financial instrument discussed in or related to this material.
This message, including any attachments or links contained herein, is subject to important disclaimers, conditions, and disclosures regarding Electronic Communications, which you can find at https://portfolio-strategy.apsec.com/sancap-disclaimers-and-disclosures.
Important Disclaimers
Copyright © 2026 Santander US Capital Markets LLC and its affiliates (“SCM”). All rights reserved. SCM is a member of FINRA and SIPC. This material is intended for limited distribution to institutions only and is not publicly available. Any unauthorized use or disclosure is prohibited.
In making this material available, SCM (i) is not providing any advice to the recipient, including, without limitation, any advice as to investment, legal, accounting, tax and financial matters, (ii) is not acting as an advisor or fiduciary in respect of the recipient, (iii) is not making any predictions or projections and (iv) intends that any recipient to which SCM has provided this material is an “institutional investor” (as defined under applicable law and regulation, including FINRA Rule 4512 and that this material will not be disseminated, in whole or part, to any third party by the recipient.
The author of this material is an economist, desk strategist or trader. In the preparation of this material, the author may have consulted or otherwise discussed the matters referenced herein with one or more of SCM’s trading desks, any of which may have accumulated or otherwise taken a position, long or short, in any of the financial instruments discussed in or related to this material. Further, SCM or any of its affiliates may act as a market maker or principal dealer and may have proprietary interests that differ or conflict with the recipient hereof, in connection with any financial instrument discussed in or related to this material.
This material (i) has been prepared for information purposes only and does not constitute a solicitation or an offer to buy or sell any securities, related investments or other financial instruments, (ii) is neither research, a “research report” as commonly understood under the securities laws and regulations promulgated thereunder nor the product of a research department, (iii) or parts thereof may have been obtained from various sources, the reliability of which has not been verified and cannot be guaranteed by SCM, (iv) should not be reproduced or disclosed to any other person, without SCM’s prior consent and (v) is not intended for distribution in any jurisdiction in which its distribution would be prohibited.
In connection with this material, SCM (i) makes no representation or warranties as to the appropriateness or reliance for use in any transaction or as to the permissibility or legality of any financial instrument in any jurisdiction, (ii) believes the information in this material to be reliable, has not independently verified such information and makes no representation, express or implied, with regard to the accuracy or completeness of such information, (iii) accepts no responsibility or liability as to any reliance placed, or investment decision made, on the basis of such information by the recipient and (iv) does not undertake, and disclaims any duty to undertake, to update or to revise the information contained in this material.
Unless otherwise stated, the views, opinions, forecasts, valuations, or estimates contained in this material are those solely of the author, as of the date of publication of this material, and are subject to change without notice. The recipient of this material should make an independent evaluation of this information and make such other investigations as the recipient considers necessary (including obtaining independent financial advice), before transacting in any financial market or instrument discussed in or related to this material.
Important disclaimers for clients in the EU and UK
This publication has been prepared by Trading Desk Strategists within the Sales and Trading functions of Santander US Capital Markets LLC (“SanCap”), the US registered broker-dealer of Santander Corporate & Investment Banking. This communication is distributed in the EEA by Banco Santander S.A., a credit institution registered in Spain and authorised and regulated by the Bank of Spain and the CNMV. Any EEA recipient of this communication that would like to affect any transaction in any security or issuer discussed herein should do so with Banco Santander S.A. or any of its affiliates (together “Santander”). This communication has been distributed in the UK by Banco Santander, S.A.’s London branch, authorised by the Bank of Spain and subject to regulatory oversight on certain matters by the Financial Conduct Authority (FCA) and the Prudential Regulation Authority (PRA).
The publication is intended for exclusive use for Professional Clients and Eligible Counterparties as defined by MiFID II and is not intended for use by retail customers or for any persons or entities in any jurisdictions or country where such distribution or use would be contrary to local law or regulation.
This material is not a product of Santander´s Research Team and does not constitute independent investment research. This is a marketing communication and may contain ¨investment recommendations¨ as defined by the Market Abuse Regulation 596/2014 ("MAR"). This publication has not been prepared in accordance with legal requirements designed to promote the independence of research and is not subject to any prohibition on dealing ahead of the dissemination of investment research. The author, date and time of the production of this publication are as indicated herein.
This publication does not constitute investment advice and may not be relied upon to form an investment decision, nor should it be construed as any offer to sell or issue or invitation to purchase, acquire or subscribe for any instruments referred herein. The publication has been prepared in good faith and based on information Santander considers reliable as of the date of publication, but Santander does not guarantee or represent, express or implied, that such information is accurate or complete. All estimates, forecasts and opinions are current as at the date of this publication and are subject to change without notice. Unless otherwise indicated, Santander does not intend to update this publication. The views and commentary in this publication may not be objective or independent of the interests of the Trading and Sales functions of Santander, who may be active participants in the markets, investments or strategies referred to herein and/or may receive compensation from investment banking and non-investment banking services from entities mentioned herein. Santander may trade as principal, make a market or hold positions in instruments (or related derivatives) and/or hold financial interest in entities discussed herein. Santander may provide market commentary or trading strategies to other clients or engage in transactions which may differ from views expressed herein. Santander may have acted upon the contents of this publication prior to you having received it.
This publication is intended for the exclusive use of the recipient and must not be reproduced, redistributed or transmitted, in whole or in part, without Santander’s consent. The recipient agrees to keep confidential at all times information contained herein.


