Uncategorized
Value in high and low TPO bank serviced pools
admin | January 17, 2020
This material is a Marketing Communication and does not constitute Independent Investment Research.
Bank originated and serviced loans typically prepay slower than similar loans from non-bank lenders. However, some banks use correspondent lenders and brokers to originate loans, which generally prepay much faster than loans originated by a bank’s retail channel. The market does a good job of identifying slower prepaying lenders, and on average bank loans from third-party originators (TPO) prepay slower than generic multi-lender pools. Pay-ups on bank serviced loans, regardless of TPO, appear very inexpensive compared to levels implied by historical prepayment speeds. High TPO loans have very low pay-ups and could interest investors looking to outperform the MBS index without much pay-up risk.
TPO makes a difference, especially at banks
Loans originated through a bank’s retail channel tend to prepay much slower than other loans, since banks are capable of monitoring and preventing adverse prepayment behavior from their own employees. Third-party originators have more flexibility. For example, if a lender will not refinance a loan originated through them until it is 6 months seasoned, a TPO can use a different lender to handle the refinance. A bank’s own employee cannot do this. Exhibit 1 compares S-curves for bank and non-bank originators, both TPO and retail, for loans with balances between $175,000 and $225,000 and for loans with balances greater than $225,000.
Exhibit 1: Bank retail loans have very flat S-curves
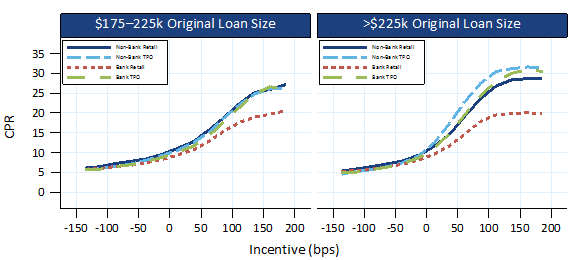
Note: Performance from 1/2014 to 12/2019 for fixed 30-year deliverable pools, 6 to 60 months seasoning. Source: Fannie Mae, Freddie Mac, eMBS, Amherst Pierpont Securities
For the lower loan balance group the bank retail loans prepay substantially slower than the other loans, but the other categories look very similar. There is a little more differentiation in the higher balance bucket. Bank retail is still much slower than the rest of the loans, but now the non-bank TPO loans prepay the fastest. The S-curves are still quite similar for non-bank retail and bank TPO, although the bank TPO do appear to be slightly faster when deep in-the-money.
Bank loans in single issuer pools outperform the multi-lender pools
Investors are diligent about monitoring the effect originators and servicers have on prepayment speeds. Therefore, single issuer pool production is dominated by lenders whose loans exhibit better convexity, since those lenders can sell their pools at a pay-up over the TBA. This means the multi-lender pools tend to prepay worse. Even the bank TPO loans delivered into single-issuer pools on average prepay better than the multi-lender pools, even though the latter pools contain some retail production. This is particularly true in the higher loan balance category (Exhibit 2).
Exhibit 2: Bank loans sold into single-issuer pools have better convexity
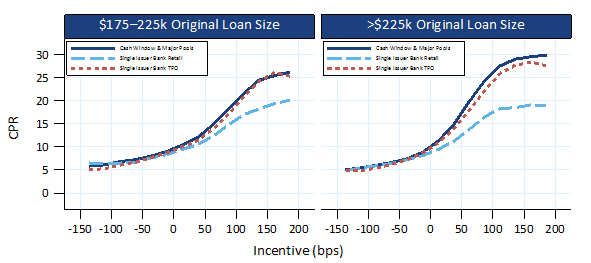
Note: Performance from 1/2014 to 12/2019 for fixed 30-year deliverable pools, 6 to 60 months seasoning. Source: Fannie Mae, Freddie Mac, eMBS, Amherst Pierpont Securities
Pay-ups for bank originated loans look cheap
Exhibit 3 shows theoretical and actual pay-ups for a variety of 3.0% coupon pools. For the loan balance categories only bank low TPO is shown, since the high TPO pools prepaid about the same as the multi pools. For generic collateral both high and low TPO is considered, since each category offers some call protection. The high and low TPO pay-ups were calculated by running December cash window pools through Yield Book’s prepayment model with the S-curve flattened to match the historical S-curves. The high TPO pool is run at 7 months of seasoning in order to assume that a high TPO pool has no prepayment benefit at low seasoning.
Exhibit 3: Pay-ups appear low for bank originated loans, regardless of TPO
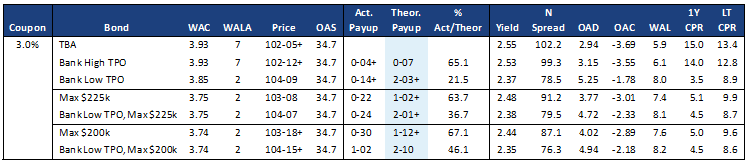
Note: Fannie Mae cash window pools are used for the specified pools. High and low TPO pools are proxied by dialing Yield Book’s production model to a flatter S-Curve consistent with the prepay data in the exhibits. Pay-ups are calculated by running the specified pools at the same OAS as the TBA. The price difference to the multi pool is the theoretical payup to TBA. Source: Yield Book, Amherst Pierpont Securities
Across all three categories, low TPO bank loans have pay-ups in the neighborhood of 40% of the theoretical value. The pay-up for low TPO loan balance pools is not much more than for the pay-up for a cash window loan balance pool but the prepayment benefit is quite large. So these pools look substantially more attractive than the cash window pools. The benefit is even larger for the non-loan balance pools, with low TPO pay-ups only 21.5% of theoretical value.
Pools of high TPO bank loans might interest managers whose performance is measured against the Bloomberg/Barclays MBS index. The pay-up over TBA is only 4.5/32s, which is 65% of the theoretical value. This is on the high side, but assumes that there is no prepayment benefit to a low WALA, high TPO pool. In reality it is likely that the high TPO pool will offer some prepayment protection at low WALA compared to the TBA, albeit not as much as a bank retail serviced pool.
These pay-ups assume the prepayment behavior is that of the average servicer, but it is likely that some lenders’ high TPO loans prepay even better than the average. This presents another opportunity to add alpha, since the market may not pay-up much for a good servicer’s high TPO production.
This material is intended only for institutional investors and does not carry all of the independence and disclosure standards of retail debt research reports. In the preparation of this material, the author may have consulted or otherwise discussed the matters referenced herein with one or more of SCM’s trading desks, any of which may have accumulated or otherwise taken a position, long or short, in any of the financial instruments discussed in or related to this material. Further, SCM may act as a market maker or principal dealer and may have proprietary interests that differ or conflict with the recipient hereof, in connection with any financial instrument discussed in or related to this material.
This message, including any attachments or links contained herein, is subject to important disclaimers, conditions, and disclosures regarding Electronic Communications, which you can find at https://portfolio-strategy.apsec.com/sancap-disclaimers-and-disclosures.
Important Disclaimers
Copyright © 2026 Santander US Capital Markets LLC and its affiliates (“SCM”). All rights reserved. SCM is a member of FINRA and SIPC. This material is intended for limited distribution to institutions only and is not publicly available. Any unauthorized use or disclosure is prohibited.
In making this material available, SCM (i) is not providing any advice to the recipient, including, without limitation, any advice as to investment, legal, accounting, tax and financial matters, (ii) is not acting as an advisor or fiduciary in respect of the recipient, (iii) is not making any predictions or projections and (iv) intends that any recipient to which SCM has provided this material is an “institutional investor” (as defined under applicable law and regulation, including FINRA Rule 4512 and that this material will not be disseminated, in whole or part, to any third party by the recipient.
The author of this material is an economist, desk strategist or trader. In the preparation of this material, the author may have consulted or otherwise discussed the matters referenced herein with one or more of SCM’s trading desks, any of which may have accumulated or otherwise taken a position, long or short, in any of the financial instruments discussed in or related to this material. Further, SCM or any of its affiliates may act as a market maker or principal dealer and may have proprietary interests that differ or conflict with the recipient hereof, in connection with any financial instrument discussed in or related to this material.
This material (i) has been prepared for information purposes only and does not constitute a solicitation or an offer to buy or sell any securities, related investments or other financial instruments, (ii) is neither research, a “research report” as commonly understood under the securities laws and regulations promulgated thereunder nor the product of a research department, (iii) or parts thereof may have been obtained from various sources, the reliability of which has not been verified and cannot be guaranteed by SCM, (iv) should not be reproduced or disclosed to any other person, without SCM’s prior consent and (v) is not intended for distribution in any jurisdiction in which its distribution would be prohibited.
In connection with this material, SCM (i) makes no representation or warranties as to the appropriateness or reliance for use in any transaction or as to the permissibility or legality of any financial instrument in any jurisdiction, (ii) believes the information in this material to be reliable, has not independently verified such information and makes no representation, express or implied, with regard to the accuracy or completeness of such information, (iii) accepts no responsibility or liability as to any reliance placed, or investment decision made, on the basis of such information by the recipient and (iv) does not undertake, and disclaims any duty to undertake, to update or to revise the information contained in this material.
Unless otherwise stated, the views, opinions, forecasts, valuations, or estimates contained in this material are those solely of the author, as of the date of publication of this material, and are subject to change without notice. The recipient of this material should make an independent evaluation of this information and make such other investigations as the recipient considers necessary (including obtaining independent financial advice), before transacting in any financial market or instrument discussed in or related to this material.
Important disclaimers for clients in the EU and UK
This publication has been prepared by Trading Desk Strategists within the Sales and Trading functions of Santander US Capital Markets LLC (“SanCap”), the US registered broker-dealer of Santander Corporate & Investment Banking. This communication is distributed in the EEA by Banco Santander S.A., a credit institution registered in Spain and authorised and regulated by the Bank of Spain and the CNMV. Any EEA recipient of this communication that would like to affect any transaction in any security or issuer discussed herein should do so with Banco Santander S.A. or any of its affiliates (together “Santander”). This communication has been distributed in the UK by Banco Santander, S.A.’s London branch, authorised by the Bank of Spain and subject to regulatory oversight on certain matters by the Financial Conduct Authority (FCA) and the Prudential Regulation Authority (PRA).
The publication is intended for exclusive use for Professional Clients and Eligible Counterparties as defined by MiFID II and is not intended for use by retail customers or for any persons or entities in any jurisdictions or country where such distribution or use would be contrary to local law or regulation.
This material is not a product of Santander´s Research Team and does not constitute independent investment research. This is a marketing communication and may contain ¨investment recommendations¨ as defined by the Market Abuse Regulation 596/2014 ("MAR"). This publication has not been prepared in accordance with legal requirements designed to promote the independence of research and is not subject to any prohibition on dealing ahead of the dissemination of investment research. The author, date and time of the production of this publication are as indicated herein.
This publication does not constitute investment advice and may not be relied upon to form an investment decision, nor should it be construed as any offer to sell or issue or invitation to purchase, acquire or subscribe for any instruments referred herein. The publication has been prepared in good faith and based on information Santander considers reliable as of the date of publication, but Santander does not guarantee or represent, express or implied, that such information is accurate or complete. All estimates, forecasts and opinions are current as at the date of this publication and are subject to change without notice. Unless otherwise indicated, Santander does not intend to update this publication. The views and commentary in this publication may not be objective or independent of the interests of the Trading and Sales functions of Santander, who may be active participants in the markets, investments or strategies referred to herein and/or may receive compensation from investment banking and non-investment banking services from entities mentioned herein. Santander may trade as principal, make a market or hold positions in instruments (or related derivatives) and/or hold financial interest in entities discussed herein. Santander may provide market commentary or trading strategies to other clients or engage in transactions which may differ from views expressed herein. Santander may have acted upon the contents of this publication prior to you having received it.
This publication is intended for the exclusive use of the recipient and must not be reproduced, redistributed or transmitted, in whole or in part, without Santander’s consent. The recipient agrees to keep confidential at all times information contained herein.


