Uncategorized
Allocating to MBS and leveraged credit
admin | January 17, 2020
This material is a Marketing Communication and does not constitute Independent Investment Research.
Performance in major US fixed income assets last year looks like an instructive guide to 2020, and it puts MBS and leveraged credit in good light. A big part of returns came from a sharp drop in rates and a rise in asset prices, something unlikely to repeat this year. But assets with yield and carry did well, and that looks like something that could repeat. There’s a straightforward case for adding exposure in MBS and credit, the higher yielding parts of credit especially.
Returns dominated by duration and spread tightening
Returns in 2019 across major US asset classes ranged from 4.53% in ABS to 14.54% in investment grade corporates (Exhibit 1). The range largely came down to differences in duration and spread tightening. The investment grade corporate index, for instance, brought duration of nearly eight years into a rallying market and spreads tightened from the start to finish of 2019 by 50 bp. High yield debt brought a duration of only three years, but spreads tightened by 144 bp—almost enough to catch the investment grade market. Leveraged loans with zero effective duration tightened by around 60 bp. MBS and ABS brought duration of three years and less with, at least for MBS, no nominal tightening from open to close. Across all sectors, of course, the greater the coupon, the stronger the compounded effect of income.
Exhibit 1: Return and risk across fixed income in 2019
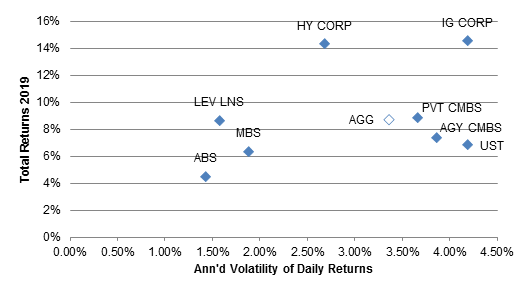
Note: Annual unhedged total returns and annualized daily volatility of returns based on the Bloomberg Barclays indices and, for leveraged loans, the S&P/LSTA Total Return Index. Source: Bloomberg, Amherst Pierpont Securities.
Sectors with comparable returns but lower risk
More interesting is the day-to-day risk that investors had to take to earn those returns. Not surprisingly, volatility roughly corresponded with sector duration. That’s where high yield, leveraged loans, MBS and ABS become more intriguing. Those sectors all offered returns with much less risk than competing assets. High yield roughly matched the returns of investment grade with roughly 60% of the daily volatility. MBS roughly matched Treasuries with 45% of the risk. Leveraged loans matched or exceeded returns in CMBS with roughly 40% of the risk. ABS trailed other returns, but with lower volatility than any other sector.
Correlation sets high yield and leveraged loans apart
The other thing worth noting is the correlation of daily returns across asset classes, where leveraged lending clearly sets itself apart from other assets (Exhibit 2). The correlation of Treasury returns with all assets outside of high yield and leveraged loans ranges around 0.90. Duration dominates returns in these assets. High yield and leveraged loan returns, however, are negatively correlated with returns on Treasuries and every other related asset. The diversifying potential in high yield and leveraged loans is clear.
Exhibit 2: Correlation across fixed income in 2019
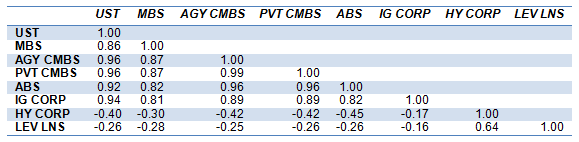
Note: Correlation of daily returns 12/31/2018-12/31/2019 based on the Bloomberg Barclays indices and, for leveraged loans, the S&P/LSTA Total Return Index. Source: Bloomberg, Amherst Pierpont Securities.
Prospects ahead
The likelihood of another sharp rally in 2020 looks low, with most of the US Treasury curve below 2.0%. That should reduce absolute returns substantially. But it should give advantage to sectors with potential to tighten and spin off compounding income.
Among the sectors most closely tied to rates, MBS looks like a strong candidate. It has a history of generating returns comparable to competing assets but with less risk, and not just in 2019. The current 41 bp OAS in the Bloomberg/Barclays MBS index is wide to its 34 bp average over the last five years. Runoff from the Fed’s portfolio poses a challenge along with an expected $300 billion in net new supply and uncertain demand from banks. But MBS is still likely to outperform Treasury debt with less volatility.
Leveraged lending in the form of high yield or leveraged loans also looks like a core holding both for delivering return with lower risk and for potential to tighten. High yield debt spreads are tight to their 5-year average but still wider than 2018. High yield tightened steadily in 2018 before the Fed convinced the market it would raise rates. With the Fed likely on hold for 2020, it would be a good environment again for high yield and leveraged lending. There are risks in slow economic growth in 2020 and in some sectors of lending where spreads widened late last year, but high yield and leverage loans should add valuable income to most portfolios and especially valuable diversification.
This material is intended only for institutional investors and does not carry all of the independence and disclosure standards of retail debt research reports. In the preparation of this material, the author may have consulted or otherwise discussed the matters referenced herein with one or more of SCM’s trading desks, any of which may have accumulated or otherwise taken a position, long or short, in any of the financial instruments discussed in or related to this material. Further, SCM may act as a market maker or principal dealer and may have proprietary interests that differ or conflict with the recipient hereof, in connection with any financial instrument discussed in or related to this material.
This message, including any attachments or links contained herein, is subject to important disclaimers, conditions, and disclosures regarding Electronic Communications, which you can find at https://portfolio-strategy.apsec.com/sancap-disclaimers-and-disclosures.
Important Disclaimers
Copyright © 2026 Santander US Capital Markets LLC and its affiliates (“SCM”). All rights reserved. SCM is a member of FINRA and SIPC. This material is intended for limited distribution to institutions only and is not publicly available. Any unauthorized use or disclosure is prohibited.
In making this material available, SCM (i) is not providing any advice to the recipient, including, without limitation, any advice as to investment, legal, accounting, tax and financial matters, (ii) is not acting as an advisor or fiduciary in respect of the recipient, (iii) is not making any predictions or projections and (iv) intends that any recipient to which SCM has provided this material is an “institutional investor” (as defined under applicable law and regulation, including FINRA Rule 4512 and that this material will not be disseminated, in whole or part, to any third party by the recipient.
The author of this material is an economist, desk strategist or trader. In the preparation of this material, the author may have consulted or otherwise discussed the matters referenced herein with one or more of SCM’s trading desks, any of which may have accumulated or otherwise taken a position, long or short, in any of the financial instruments discussed in or related to this material. Further, SCM or any of its affiliates may act as a market maker or principal dealer and may have proprietary interests that differ or conflict with the recipient hereof, in connection with any financial instrument discussed in or related to this material.
This material (i) has been prepared for information purposes only and does not constitute a solicitation or an offer to buy or sell any securities, related investments or other financial instruments, (ii) is neither research, a “research report” as commonly understood under the securities laws and regulations promulgated thereunder nor the product of a research department, (iii) or parts thereof may have been obtained from various sources, the reliability of which has not been verified and cannot be guaranteed by SCM, (iv) should not be reproduced or disclosed to any other person, without SCM’s prior consent and (v) is not intended for distribution in any jurisdiction in which its distribution would be prohibited.
In connection with this material, SCM (i) makes no representation or warranties as to the appropriateness or reliance for use in any transaction or as to the permissibility or legality of any financial instrument in any jurisdiction, (ii) believes the information in this material to be reliable, has not independently verified such information and makes no representation, express or implied, with regard to the accuracy or completeness of such information, (iii) accepts no responsibility or liability as to any reliance placed, or investment decision made, on the basis of such information by the recipient and (iv) does not undertake, and disclaims any duty to undertake, to update or to revise the information contained in this material.
Unless otherwise stated, the views, opinions, forecasts, valuations, or estimates contained in this material are those solely of the author, as of the date of publication of this material, and are subject to change without notice. The recipient of this material should make an independent evaluation of this information and make such other investigations as the recipient considers necessary (including obtaining independent financial advice), before transacting in any financial market or instrument discussed in or related to this material.
Important disclaimers for clients in the EU and UK
This publication has been prepared by Trading Desk Strategists within the Sales and Trading functions of Santander US Capital Markets LLC (“SanCap”), the US registered broker-dealer of Santander Corporate & Investment Banking. This communication is distributed in the EEA by Banco Santander S.A., a credit institution registered in Spain and authorised and regulated by the Bank of Spain and the CNMV. Any EEA recipient of this communication that would like to affect any transaction in any security or issuer discussed herein should do so with Banco Santander S.A. or any of its affiliates (together “Santander”). This communication has been distributed in the UK by Banco Santander, S.A.’s London branch, authorised by the Bank of Spain and subject to regulatory oversight on certain matters by the Financial Conduct Authority (FCA) and the Prudential Regulation Authority (PRA).
The publication is intended for exclusive use for Professional Clients and Eligible Counterparties as defined by MiFID II and is not intended for use by retail customers or for any persons or entities in any jurisdictions or country where such distribution or use would be contrary to local law or regulation.
This material is not a product of Santander´s Research Team and does not constitute independent investment research. This is a marketing communication and may contain ¨investment recommendations¨ as defined by the Market Abuse Regulation 596/2014 ("MAR"). This publication has not been prepared in accordance with legal requirements designed to promote the independence of research and is not subject to any prohibition on dealing ahead of the dissemination of investment research. The author, date and time of the production of this publication are as indicated herein.
This publication does not constitute investment advice and may not be relied upon to form an investment decision, nor should it be construed as any offer to sell or issue or invitation to purchase, acquire or subscribe for any instruments referred herein. The publication has been prepared in good faith and based on information Santander considers reliable as of the date of publication, but Santander does not guarantee or represent, express or implied, that such information is accurate or complete. All estimates, forecasts and opinions are current as at the date of this publication and are subject to change without notice. Unless otherwise indicated, Santander does not intend to update this publication. The views and commentary in this publication may not be objective or independent of the interests of the Trading and Sales functions of Santander, who may be active participants in the markets, investments or strategies referred to herein and/or may receive compensation from investment banking and non-investment banking services from entities mentioned herein. Santander may trade as principal, make a market or hold positions in instruments (or related derivatives) and/or hold financial interest in entities discussed herein. Santander may provide market commentary or trading strategies to other clients or engage in transactions which may differ from views expressed herein. Santander may have acted upon the contents of this publication prior to you having received it.
This publication is intended for the exclusive use of the recipient and must not be reproduced, redistributed or transmitted, in whole or in part, without Santander’s consent. The recipient agrees to keep confidential at all times information contained herein.


