


Uncategorized
The NAIC stresses CLOs, especially combo note holders
admin | January 10, 2020
This material is a Marketing Communication and does not constitute Independent Investment Research.
After studying the performance of insurers’ CLOs in projected stress scenarios, the National Association of Insurance Commissioners has dialed up the pressure on holders of CLO combo notes. The NAIC stress tests found no principal losses in ‘AAA’ through ‘A’ CLOs even in the worst case, while lower rated classes and combo notes took material losses. The study concluded CLOs pose limited risk to insurers overall but could lead to substantial changes in capital required for combo notes, potentially reducing demand for speculative grade CLO debt and equity.
The study comes after a July 2, 2019, letter from the NAIC securities valuation office urging the association to stop allowing insurers to use combo note ratings to set statutory capital. CLO combo notes, which often combine CLO equity with other classes, can carry a much higher rating than most of the underlying classes and allow an insurer to hold substantially less capital. The valuation office proposed using regulators to set combo note capital starting in early 2020 and said it would not support grandfathering of current holdings. On December 16, DBRS Morningstar, a leading provider of CLO combo note ratings, stopped providing new ratings.
Setting stress defaults and recoveries
The NAIC released its CLO stress analysis in a December 6 special report arguing that a rise in loans with limited covenants, low or no subordinate debt and higher leverage could cut potential loan recoveries from historic norms. It decided to stress CLO performance by assuming loan recoveries would fall to levels comparable to unsecured debt.
To create historical and stress case default scenarios, the NAIC used the first 10-years of defaults for cohorts of corporate debt from 1970 to 2009. It refined the history for ‘Ba’ through ‘Ca’ issuers into finer rating categories from ‘Ba1’ through ‘Ca-C.’ For each rating category, the NAIC ended up with 40 default histories. For ‘Ba2’ credits, for instance, the cumulative default rate over 10 years ranged from 4.8% to 25.3% and, weighted by number of issuers in each cohort, averaged 13.4% (Exhibit 1). The NAIC calculated the average historic default rate year-by-year for 10-years in each rating category and the default rate one standard deviation higher. The NAIC published a note showing default series for each rating category.
Exhibit 1: A ‘B2’ example of the historic default rates used by the NAIC
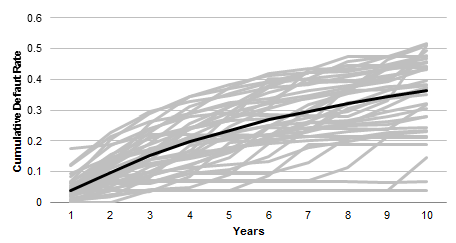
Note: Dark line shows the issuer-weighted average for 1970-2009. Source: NAIC, Moody’s, Amherst Pierpont Securities calculations
The NAIC also assumed recoveries implied by the prices of traded debt would step down to levels historically associated with unsecured debt. For first lien bank loans, recoveries fell from near 64% to near 40% while recoveries for other possible assets fell to lower levels, too (Exhibit 2).
Exhibit 2: NAIC assumed loan recoveries implied by prices dropped
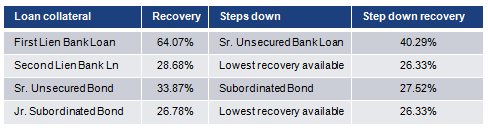
Source: NAIC, Moody’s, Amherst Pierpont Securities
The study did make a range of other simplifying assumptions. It excluded CRE CLOs, middle market CLOs, TruPs and non-US CLOs. It also did no modeling of correlations between loan defaults or recoveries across industries, differentiating loans based only on ratings and seniority. It also assumed no loan repayments. The study authors noted they may revisit these assumptions.
The NAIC then combined projected default and recovery assumptions into scenarios that varied in severity from historical defaults and recoveries to elevated defaults and lower recoveries (Exhibit 3).
Exhibit 3: NAIC CLO stress test scenarios
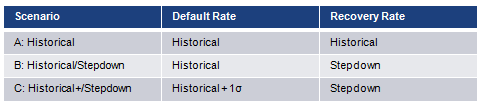
Source: NAIC, Amherst Pierpont Securities
Good news for ‘AAA’ through ‘A,’ challenges elsewhere
Based on insurer CLO holdings at the end of 2018, the NAIC ran underlying loan pools for 919 unique deals through the stress scenarios, generating losses that ran from 9.70% in the historical scenario to 19.11% in the most stressed (Exhibit 4).
Exhibit 4: Projected leveraged loan pool losses varied from 9.70% to 19.11%
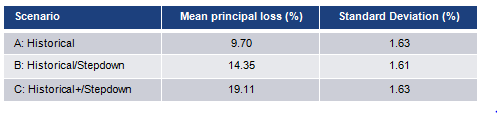
Source: NAIC, Amherst Pierpont Securities
When the NAIC pushed projected pool cash flows through the waterfall for the standard CLO tranches owned by insurers, the $95.6 billion of accurately modeled securities with CUSIPs showed no losses on ‘AAA’ through ‘A’ even in the harshest scenario (Exhibit 5). Given the relatively high level of assumed defaults, at least compared to current levels, and the sharply lower assumed recoveries, the lack of principal losses speaks to the strong structural protections for these classes.
Exhibit 5: NAIC projected CLO principal losses in stress scenarios
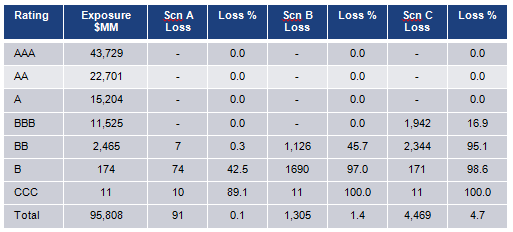
Source: NAIC, Amherst Pierpont Securities
For the $1.0 billion of equity or combo notes identified by the NAIC, counting any interrupted cash flow to equity as a loss, losses ranged from 28% in scenario A to 30% in scenario C. “The risk on rated combo notes is not comparable with similarly rated normal tranches,” the NAIC wrote. “Among the modeled combo notes, losses reached AA-rated tranches.”
The NAIC also noted that combo note exposure is generally concentrated in a small set of insurance companies, although the risk to capital and surplus at those insurers from a stress scenario was substantial.
Alternative assumptions for a stress analysis
In continuing to analyze CLO exposure, the NAIC could choose other assumptions particularly around default rates, recoveries, diversification and repayments.
Alternative default rates
An alternative to the average default rate from 1970 to 2009 might focus on cohorts most similar to 2019. Similarity might be defined on reasonable measures of macro conditions in at the start of a year: recent GDP growth, yield curve slope, credit spread, inflation, and implied volatility. Using several subsets of these measures, because data were not all available for all years, a clustering model grouped the 40 cohorts and 2019 into groups of years most alike.
Results show that the nearest neighbors to 2019 are 1979, 1980, 1989, 1990, 1995, 1996, 1998-2001, 2006 and 2007. The results barely changed after re-running the model with 4, 6, 8 or 10 clusters. The robustness of the results is encouraging.
The average default rates in ‘Ba2’ and ‘B2’ using nearest neighbors and using all cohorts were close. The difference in ‘Ba2’ between the two average default vectors is minimal, whereas the average defaults in ‘B2’ among the nearest neighbors is a little higher. Overall, the nearest neighbors show weighted-average defaults close to the 40-year average.
Exhibit 6: Average and nearest-neighbor defaults look similar
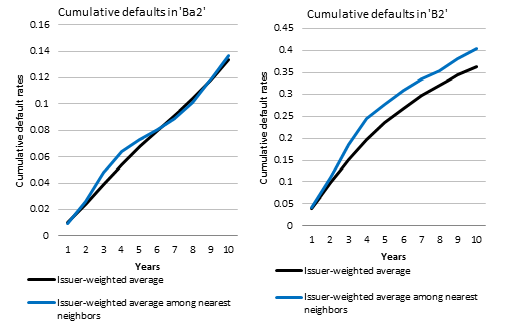
Source: NAIC, Amherst Pierpont Securities
Alternative recovery rates
The study also makes the key assumption that recoveries drop to the level of unsecured debt. Many investors believe recoveries will drop below historic levels and often stress deals assuming levels from 55% to 65%. There’s also the possibility of considering eventual recoveries rather than levels implied by debt trading prices. Those are much higher, although CLO managers may not have the luxury of waiting that long if interruption in interest payments puts pressure on overcollateralization or interest coverage tests (Exhibit 7).
Exhibit 7: Ultimate loan recoveries come in much higher than price-implied levels
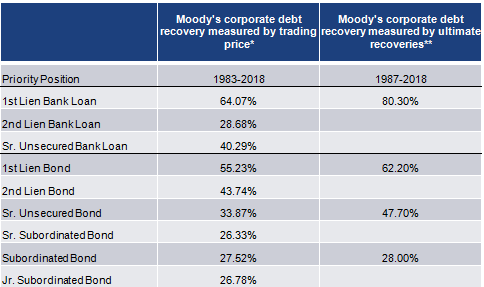
Source: Moody’s Investor Service (2019), Annual default study: Defaults will rise modestly in 2019 amid higher volatility, Exhibits 7 and 9.
Alternative assumptions about diversification
By making no assumptions about correlation between loan defaults and losses and viewing loans just based on rating and seniority, the study implies no diversification. Even though it is fair to assume correlations change under stress, it may be better to look at correlations in past stress episodes such as the aftermath of the Internet bubble or the 2008 financial crisis.
Alternative assumptions about repayments
The study also assumes loans show no repayments, extending the average life of the loans and raising losses. However, even in 2008, repayments still bottomed around 10% (Exhibit 8). Follow-up work should consider a higher repayment rate.
Exhibit 8: Leveraged loan repayments after 2008 bottomed around 10%
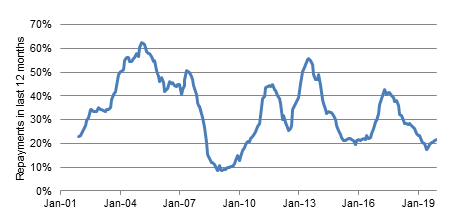
Source: LCD
Market implications
The NAIC study looks like a strong endorsement of the principal safety of most ‘AAA’ through ‘A’ CLOs but a warning sign about combo notes. It seems likely that statutory capital requirements for combo notes will rise sharply, cutting demand from insurers that own those notes.
Beyond the immediate implications, the NAIC study offers a useful road map to stress testing any CLO tranche or portfolio. The method is generally reasonable and straightforward, with room for fair disagreement on some of the key assumptions.