Uncategorized
CLO managers ride a loan roller coaster into November
admin | December 6, 2019
This material is a Marketing Communication and does not constitute Independent Investment Research.
A volatile market in leveraged loans this fall has put a drag on the performance of many portfolios backing CLOs. After accounting for portfolios’ broad market exposure, or beta, the share of managers delivering excess return over the three months ending in November dipped to 38%. The whipsaw in loan performance also turned portfolio returns more into a test of manager skill than portfolio beta. Excess returns ranged from the 59 bp turned in by PineBridge Investments to the 168 bp of underperformance turned in by the bottom performer.
The leader and the laggard
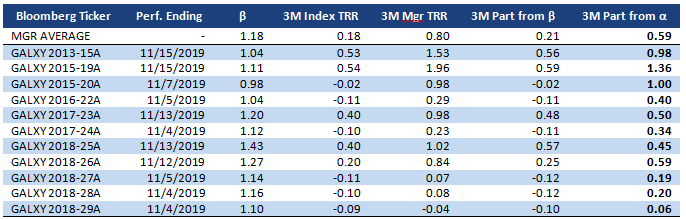
PineBridge’s excess return came from consistently strong performance across the 11 deals tracked by Amherst Pierpont (Exhibit 1). Historic performance in the manager’s leveraged loan portfolios generally has tracked S&P/LSTA Index returns with a beta of 1.18, meaning index returns of 1% came with an average PineBridge return of 1.18%. For the three months ending in November, the index returned 0.18%. PineBridge’s beta would have projected returns of 0.21%. But since the manager’s portfolios instead delivered 0.80%, the alpha amounted to the difference, or 0.59%.
PineBridge currently holds loan portfolios with a high weighted average price (78 percentile), low rating factor (36 percentile), a very low spread (2 percentile) and a high diversity score (71 percentile). PineBridge also shows a very high weighted average bid depth (98 percentile).
Exhibit 1: Consistent strong alpha into November across PineBridge deals
Note: Performance attribution starts with calculated total return on the leveraged loan portfolio held in each CLO for the 3-month reporting period ending on the indicated date. CLOs, even with a single manager platform, may vary in reporting period. The analysis matches performance in each period to performance over the identical period in the S&P/LSTA Leveraged Loan Index. Where a deal has at least 18 months of performance history since pricing and no apparent errors in cash flow data, the analysis calculates a deal beta. The deal beta is multiplied by the index return to predict deal return attributable to broad market performance. Where no beta can be calculated, the analysis uses the average beta across manager deals weighted by the average deal principal balance over time. A manager’s average beta reflects all deals ever issued or acquired by the platform. Any difference between performance attributable to beta and actual performance is attributed to manager alpha. Source: Amherst Pierpont Securities
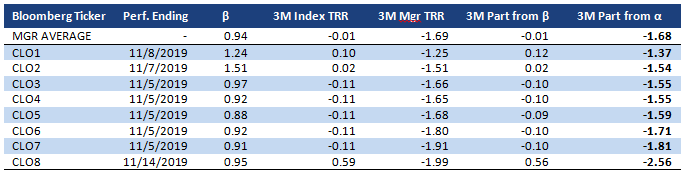
The poorest performing manager consistently underperformed across eight deals tracked by Amherst Pierpont (Exhibit 2). This manager has generally tracked S&P/LSTA index returns with a beta of 0.94. For the three months ending in September, index returns over this manager’s reporting period hit -0.01%. The manager’s beta would have projected returns of -0.01%. But the manager instead delivered -1.69%, for an alpha of -1.68%.
In contrast to PineBridge, the lowest ranked manager tends to carry loans with low prices (4 percentile), high rating factor (78 percentile), high spreads (97 percentile) and high diversity (92 percentile). The weighted average bid depth for this manager is notably low (10 percentile).
Exhibit 2: Consistent and significant underperformance for the bottom manager
Note: for methodology, see note for Exhibit 1. Source: Amherst Pierpont Securities
Volatile markets gave advantage to liquid portfolios
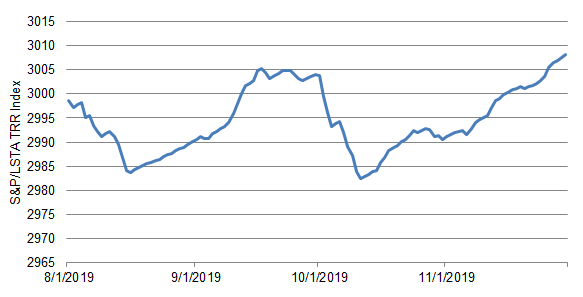
Managers had to navigate volatile markets for the three months ending in November. The S&P/LSTA leveraged loan total return index seesawed up and down through the period. Total returns on the broad market fell for the first half of August before steadily rebounding to the end of September. Early October saw another sharp downturn before returns climbed back through the end of November.
Exhibit 3: CLO managers navigated volatile markets through November
Source: Bloomberg, Amherst Pierpont Securities
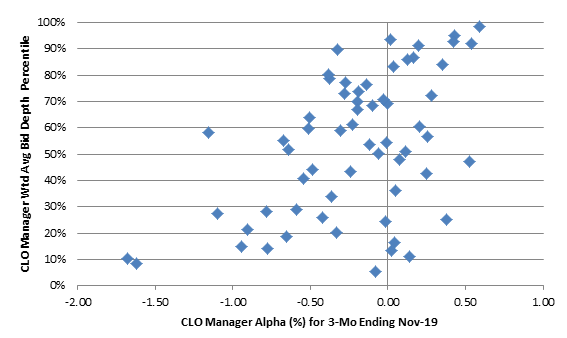
The volatility seemed to give advantage to relatively liquid loan portfolios. Managers with relatively high weighted average bid depth tended to have more alpha through November than managers with relatively low bid depth (Exhibit 4). Managers with more liquidity presumably could take advantage of the ups and down to trade in and out of positions. More liquid loans also tend to come from better credit, and spreads on ‘BB’ and other relatively highly rated loans have tightened through the fall while ‘B’ and lower rated loans have widened. Flexibility and tighter spreads could have both contributed.
Exhibit 4: Managers with more liquid loans outperformed less liquid peers
Source: Amherst Pierpont Securities
The volatility helped drag the share of managers with excess return to 38% from 48% as recently as September. Amherst Pierpont currently tracks rolling 3-month returns across 63 managers, and only 24 through November added return beyond the index (Exhibit 5). Managers showed an average excess return of -20 bp, a median of -12 bp and a standard deviation of 48 bp.
Exhibit 5: Only 24 of 63 managers tracked beat the index
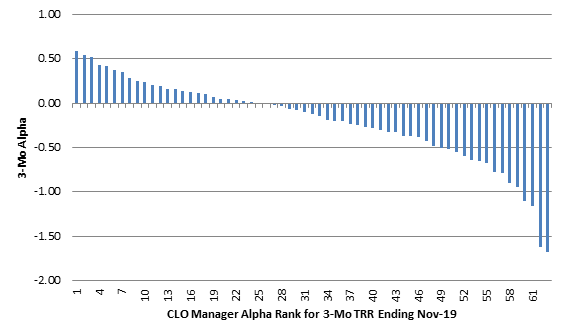
Note: for methodology, see note for Exhibit 1. Source: Amherst Pierpont Securities
Challenging markets ahead
CLO managers face some challenges ahead as the performance of ‘BB’ and ‘B’ loans continue to diverge. ‘BB’ loans have tightened through the fall and look likely to continue as CLOs try to offset the heavy supply of ‘B-’ loans. ‘B-’ loans, which are at their widest spread to ‘BB’ in 10 years, face some pressure ahead if spreads remain wide. Issuers that need to rollover or refinance debt could have trouble, raising the risk of downgrade. CLO managers will have to navigate those waters, and portfolio liquidity looks likely to remain valuable.
The list of managers adding excess return through November is below (Exhibit 6).
Exhibit 6: CLO manager alpha leaders for the three months ending in November
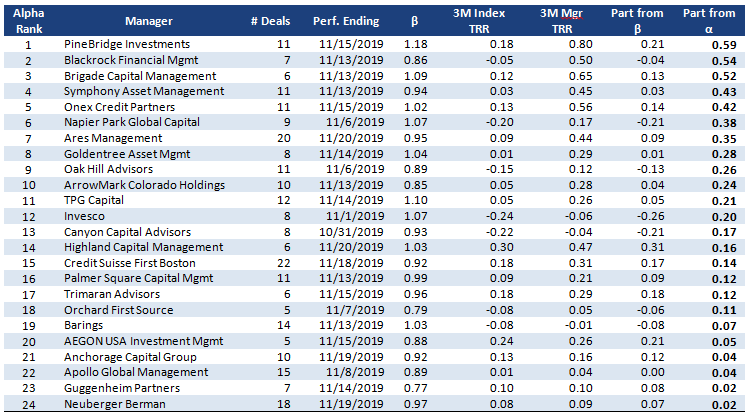
Note: for methodology, see note for Exhibit 1. Source: Amherst Pierpont Securities
This material is intended only for institutional investors and does not carry all of the independence and disclosure standards of retail debt research reports. In the preparation of this material, the author may have consulted or otherwise discussed the matters referenced herein with one or more of SCM’s trading desks, any of which may have accumulated or otherwise taken a position, long or short, in any of the financial instruments discussed in or related to this material. Further, SCM may act as a market maker or principal dealer and may have proprietary interests that differ or conflict with the recipient hereof, in connection with any financial instrument discussed in or related to this material.
This message, including any attachments or links contained herein, is subject to important disclaimers, conditions, and disclosures regarding Electronic Communications, which you can find at https://portfolio-strategy.apsec.com/sancap-disclaimers-and-disclosures.
Important Disclaimers
Copyright © 2026 Santander US Capital Markets LLC and its affiliates (“SCM”). All rights reserved. SCM is a member of FINRA and SIPC. This material is intended for limited distribution to institutions only and is not publicly available. Any unauthorized use or disclosure is prohibited.
In making this material available, SCM (i) is not providing any advice to the recipient, including, without limitation, any advice as to investment, legal, accounting, tax and financial matters, (ii) is not acting as an advisor or fiduciary in respect of the recipient, (iii) is not making any predictions or projections and (iv) intends that any recipient to which SCM has provided this material is an “institutional investor” (as defined under applicable law and regulation, including FINRA Rule 4512 and that this material will not be disseminated, in whole or part, to any third party by the recipient.
The author of this material is an economist, desk strategist or trader. In the preparation of this material, the author may have consulted or otherwise discussed the matters referenced herein with one or more of SCM’s trading desks, any of which may have accumulated or otherwise taken a position, long or short, in any of the financial instruments discussed in or related to this material. Further, SCM or any of its affiliates may act as a market maker or principal dealer and may have proprietary interests that differ or conflict with the recipient hereof, in connection with any financial instrument discussed in or related to this material.
This material (i) has been prepared for information purposes only and does not constitute a solicitation or an offer to buy or sell any securities, related investments or other financial instruments, (ii) is neither research, a “research report” as commonly understood under the securities laws and regulations promulgated thereunder nor the product of a research department, (iii) or parts thereof may have been obtained from various sources, the reliability of which has not been verified and cannot be guaranteed by SCM, (iv) should not be reproduced or disclosed to any other person, without SCM’s prior consent and (v) is not intended for distribution in any jurisdiction in which its distribution would be prohibited.
In connection with this material, SCM (i) makes no representation or warranties as to the appropriateness or reliance for use in any transaction or as to the permissibility or legality of any financial instrument in any jurisdiction, (ii) believes the information in this material to be reliable, has not independently verified such information and makes no representation, express or implied, with regard to the accuracy or completeness of such information, (iii) accepts no responsibility or liability as to any reliance placed, or investment decision made, on the basis of such information by the recipient and (iv) does not undertake, and disclaims any duty to undertake, to update or to revise the information contained in this material.
Unless otherwise stated, the views, opinions, forecasts, valuations, or estimates contained in this material are those solely of the author, as of the date of publication of this material, and are subject to change without notice. The recipient of this material should make an independent evaluation of this information and make such other investigations as the recipient considers necessary (including obtaining independent financial advice), before transacting in any financial market or instrument discussed in or related to this material.
Important disclaimers for clients in the EU and UK
This publication has been prepared by Trading Desk Strategists within the Sales and Trading functions of Santander US Capital Markets LLC (“SanCap”), the US registered broker-dealer of Santander Corporate & Investment Banking. This communication is distributed in the EEA by Banco Santander S.A., a credit institution registered in Spain and authorised and regulated by the Bank of Spain and the CNMV. Any EEA recipient of this communication that would like to affect any transaction in any security or issuer discussed herein should do so with Banco Santander S.A. or any of its affiliates (together “Santander”). This communication has been distributed in the UK by Banco Santander, S.A.’s London branch, authorised by the Bank of Spain and subject to regulatory oversight on certain matters by the Financial Conduct Authority (FCA) and the Prudential Regulation Authority (PRA).
The publication is intended for exclusive use for Professional Clients and Eligible Counterparties as defined by MiFID II and is not intended for use by retail customers or for any persons or entities in any jurisdictions or country where such distribution or use would be contrary to local law or regulation.
This material is not a product of Santander´s Research Team and does not constitute independent investment research. This is a marketing communication and may contain ¨investment recommendations¨ as defined by the Market Abuse Regulation 596/2014 ("MAR"). This publication has not been prepared in accordance with legal requirements designed to promote the independence of research and is not subject to any prohibition on dealing ahead of the dissemination of investment research. The author, date and time of the production of this publication are as indicated herein.
This publication does not constitute investment advice and may not be relied upon to form an investment decision, nor should it be construed as any offer to sell or issue or invitation to purchase, acquire or subscribe for any instruments referred herein. The publication has been prepared in good faith and based on information Santander considers reliable as of the date of publication, but Santander does not guarantee or represent, express or implied, that such information is accurate or complete. All estimates, forecasts and opinions are current as at the date of this publication and are subject to change without notice. Unless otherwise indicated, Santander does not intend to update this publication. The views and commentary in this publication may not be objective or independent of the interests of the Trading and Sales functions of Santander, who may be active participants in the markets, investments or strategies referred to herein and/or may receive compensation from investment banking and non-investment banking services from entities mentioned herein. Santander may trade as principal, make a market or hold positions in instruments (or related derivatives) and/or hold financial interest in entities discussed herein. Santander may provide market commentary or trading strategies to other clients or engage in transactions which may differ from views expressed herein. Santander may have acted upon the contents of this publication prior to you having received it.
This publication is intended for the exclusive use of the recipient and must not be reproduced, redistributed or transmitted, in whole or in part, without Santander’s consent. The recipient agrees to keep confidential at all times information contained herein.


