Uncategorized
Examining available roll for 6-year/5-year financial bonds
admin | November 22, 2019
This material is a Marketing Communication and does not constitute Independent Investment Research.
Heading into year-end, there is attractive yield pick up available among aging bonds in the Bank/Financial sector in the 6-year part of the curve that are scheduled to roll into the more liquid 5-year segment. Yield pick up is highest among Broker/Asset Managers and Banks, while the efficiency and price consistency among Insurance and REIT issuers results in fewer opportunities to take advantage of the roll.
Exhibit 1. US public bank & thrift aggregate debt maturity profile ($ millions); 5-year debt is among the most concentrated tranches in the Bank sector.
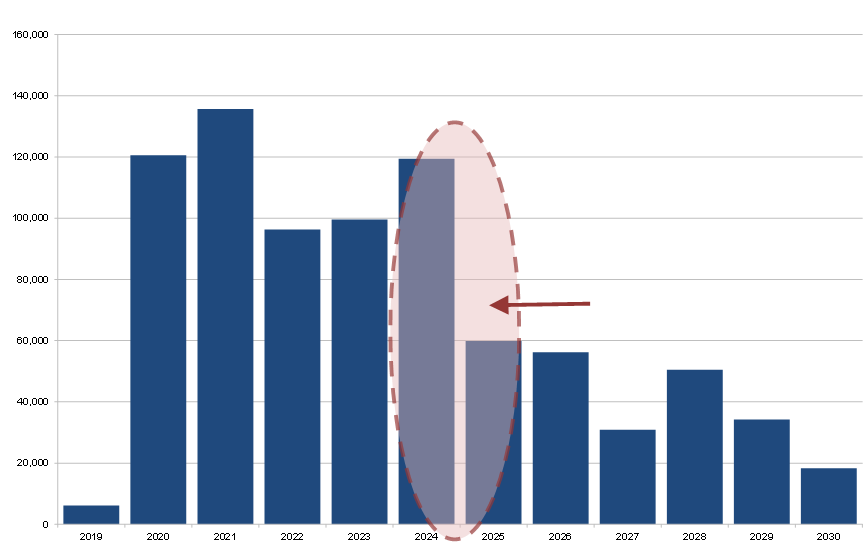
Source: S&P Global Market Intelligence
IG corporates, A-rated Financials and BBB-rated Financials yield (Exhibit 2) and spread curves are mostly flatter than where they stood at the beginning of September, as the front-end of the UST curve has since adjusted to revised rate expectations for 2020. Still, the 5s/7s part of all three corporate yield curves are steeper over those nearly three months of trading, as are the spread curves (Exhibit 3).
Exhibit 2. Current yield curves
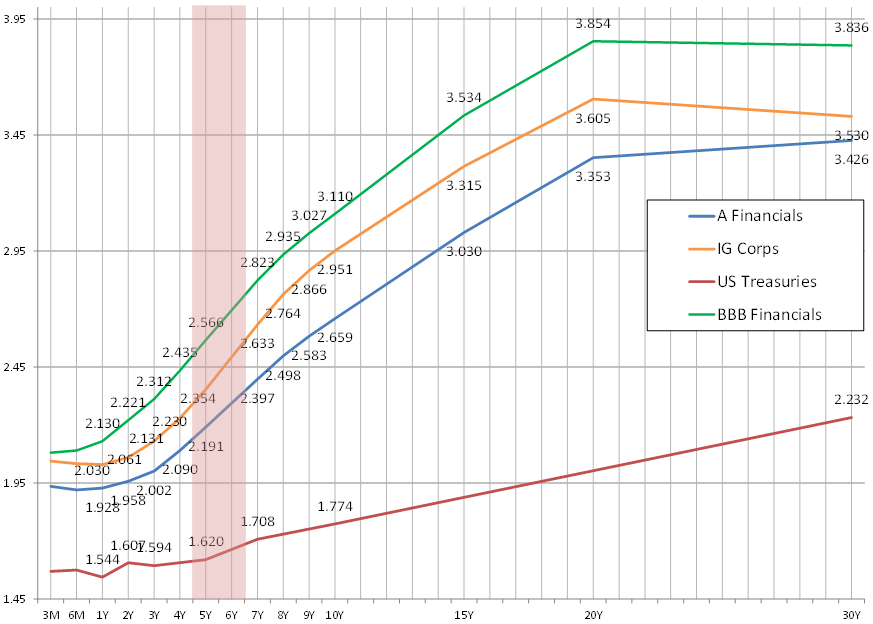
Note: The highlighted area corresponds to the 5- to 7-year duration bucket. Source: Amherst Pierpont, Bloomberg LP
The study focuses on index-eligible IG bonds with 6-year final maturity or 6-year call periods, mostly to capture the more liquid, and very common bond deals that have been issued with TLAC-enhancing one-year calls. These bonds lose TLAC-eligibility in their final year, and trade with a high likelihood that the call date will more than likely be their effective maturities. All the 6-year bonds selected still trade versus the 10-year UST Benchmark (T 1 3/4 11/15/29) according to TRACE. Within Financials, a total of just under 100 bonds were selected across the Banks, Broker/Asset Manager, Insurance, and REITs subgroups.
Exhibit 3. Current spread curves
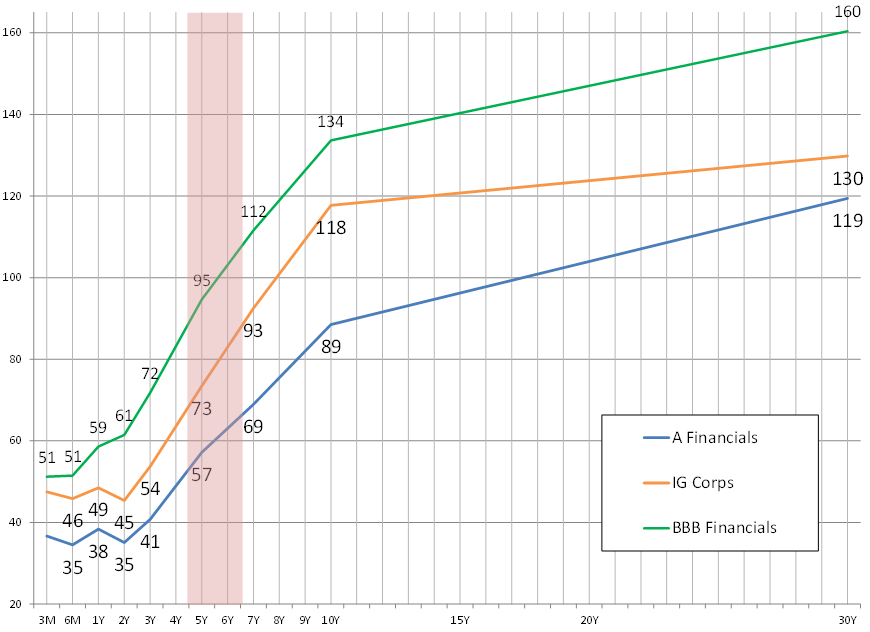
Note: The highlighted area corresponds to the 5- to 7-year duration bucket. Source: Amherst Pierpont, Bloomberg LP
Those bonds were compared against the more suitable on-the-run 5-year notes for each issuer with either a late 2024 or 2025 maturity, or a 5-year likely call date. Bonds with matching structures (senior, subordinated, secured) were chosen, with an emphasis on the more liquid deals where more than one is available. The difference in G-spread was examined for each issuer to determine the overall spread pick versus the curve from the 6-year note to the 5-year note. The available spread pick on a monthly basis was calculated to help eliminate any significant differences in maturity; and care was taken to note the dollar price premiums or discounts, as well as deal sizes, which also have material influence on valuation.
The main takeaway is that though steeper than three months ago, this remains a highly efficient part of the spread curve for each of these market segments. Broker/Asset Managers offered the best overall picks, but this is not surprising given the less liquid names available and the limited number of issuers within the study. Insurance appeared the most efficient (offering the least roll pick), while REITs also surprisingly offered limited pick-up overall, as many of the issuers in the IG REIT segment tapped the market in consecutive years, lending a lot of price consistency among issuers. Banks offered second most roll opportunity, despite the highly defined and liquid markets for the biggest issuers. Yankee banks, and particularly subs, accounted for the largest portion of this apparent spread opportunity.
Exhibit 4. Sector averages for yield pick from 6-year to 5-year maturities
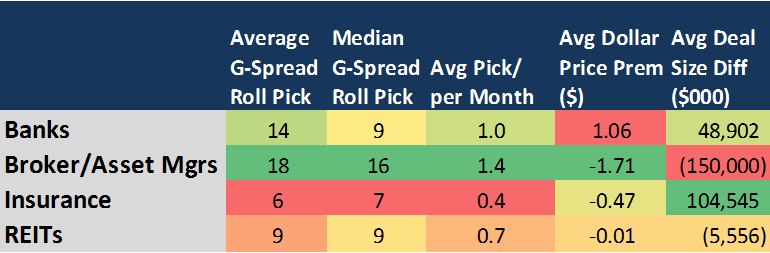
Source: Amherst Pierpont, Bloomberg/TRACE G-spread indications as of 11/21/19
A sample of the most attractive spread picks available within each of the Financial subgroups is shown in Exhibit 5. Again, the overall takeaway was that most segments exhibited a high degree of efficiency, with as little as <1 bp per month of roll, which often needs to be scaled down due to lack of liquidity and/or dollar price considerations.
Exhibit 5. Top available G-spread pick-up by sector, using roll to 5-year from 6-year maturities
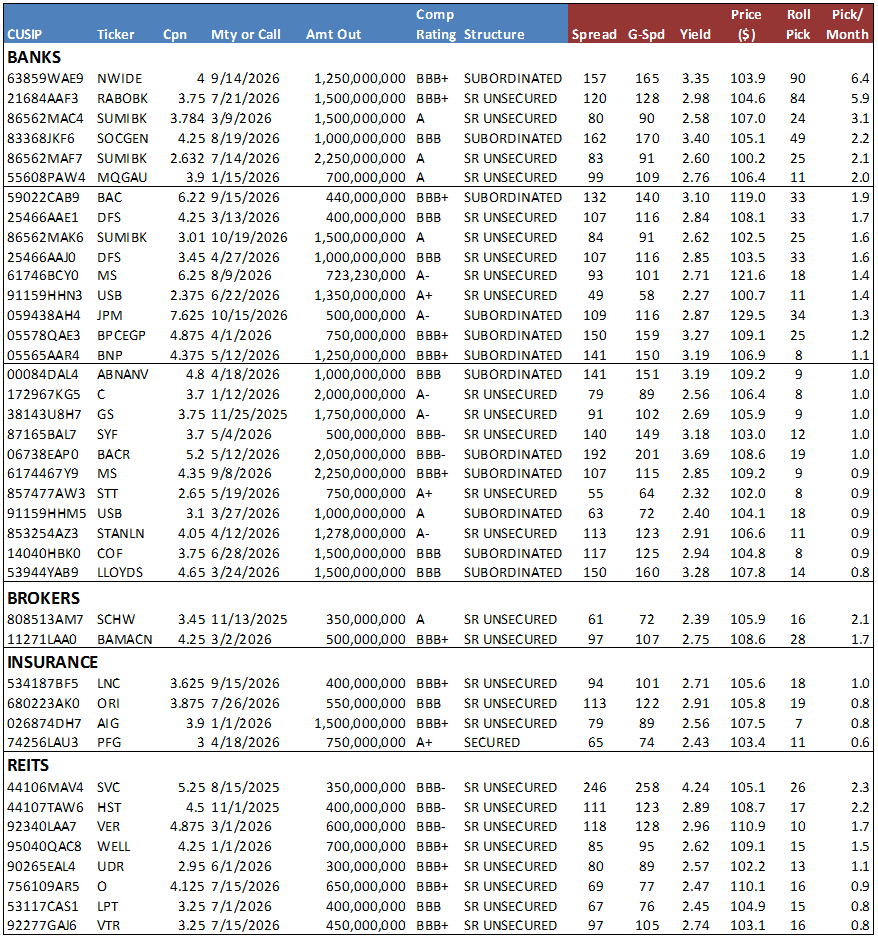
Source: Amherst Pierpont, Bloomberg/TRACE G-spread indications as of 11/21/19
This material is intended only for institutional investors and does not carry all of the independence and disclosure standards of retail debt research reports. In the preparation of this material, the author may have consulted or otherwise discussed the matters referenced herein with one or more of SCM’s trading desks, any of which may have accumulated or otherwise taken a position, long or short, in any of the financial instruments discussed in or related to this material. Further, SCM may act as a market maker or principal dealer and may have proprietary interests that differ or conflict with the recipient hereof, in connection with any financial instrument discussed in or related to this material.
This message, including any attachments or links contained herein, is subject to important disclaimers, conditions, and disclosures regarding Electronic Communications, which you can find at https://portfolio-strategy.apsec.com/sancap-disclaimers-and-disclosures.
Important Disclaimers
Copyright © 2026 Santander US Capital Markets LLC and its affiliates (“SCM”). All rights reserved. SCM is a member of FINRA and SIPC. This material is intended for limited distribution to institutions only and is not publicly available. Any unauthorized use or disclosure is prohibited.
In making this material available, SCM (i) is not providing any advice to the recipient, including, without limitation, any advice as to investment, legal, accounting, tax and financial matters, (ii) is not acting as an advisor or fiduciary in respect of the recipient, (iii) is not making any predictions or projections and (iv) intends that any recipient to which SCM has provided this material is an “institutional investor” (as defined under applicable law and regulation, including FINRA Rule 4512 and that this material will not be disseminated, in whole or part, to any third party by the recipient.
The author of this material is an economist, desk strategist or trader. In the preparation of this material, the author may have consulted or otherwise discussed the matters referenced herein with one or more of SCM’s trading desks, any of which may have accumulated or otherwise taken a position, long or short, in any of the financial instruments discussed in or related to this material. Further, SCM or any of its affiliates may act as a market maker or principal dealer and may have proprietary interests that differ or conflict with the recipient hereof, in connection with any financial instrument discussed in or related to this material.
This material (i) has been prepared for information purposes only and does not constitute a solicitation or an offer to buy or sell any securities, related investments or other financial instruments, (ii) is neither research, a “research report” as commonly understood under the securities laws and regulations promulgated thereunder nor the product of a research department, (iii) or parts thereof may have been obtained from various sources, the reliability of which has not been verified and cannot be guaranteed by SCM, (iv) should not be reproduced or disclosed to any other person, without SCM’s prior consent and (v) is not intended for distribution in any jurisdiction in which its distribution would be prohibited.
In connection with this material, SCM (i) makes no representation or warranties as to the appropriateness or reliance for use in any transaction or as to the permissibility or legality of any financial instrument in any jurisdiction, (ii) believes the information in this material to be reliable, has not independently verified such information and makes no representation, express or implied, with regard to the accuracy or completeness of such information, (iii) accepts no responsibility or liability as to any reliance placed, or investment decision made, on the basis of such information by the recipient and (iv) does not undertake, and disclaims any duty to undertake, to update or to revise the information contained in this material.
Unless otherwise stated, the views, opinions, forecasts, valuations, or estimates contained in this material are those solely of the author, as of the date of publication of this material, and are subject to change without notice. The recipient of this material should make an independent evaluation of this information and make such other investigations as the recipient considers necessary (including obtaining independent financial advice), before transacting in any financial market or instrument discussed in or related to this material.
Important disclaimers for clients in the EU and UK
This publication has been prepared by Trading Desk Strategists within the Sales and Trading functions of Santander US Capital Markets LLC (“SanCap”), the US registered broker-dealer of Santander Corporate & Investment Banking. This communication is distributed in the EEA by Banco Santander S.A., a credit institution registered in Spain and authorised and regulated by the Bank of Spain and the CNMV. Any EEA recipient of this communication that would like to affect any transaction in any security or issuer discussed herein should do so with Banco Santander S.A. or any of its affiliates (together “Santander”). This communication has been distributed in the UK by Banco Santander, S.A.’s London branch, authorised by the Bank of Spain and subject to regulatory oversight on certain matters by the Financial Conduct Authority (FCA) and the Prudential Regulation Authority (PRA).
The publication is intended for exclusive use for Professional Clients and Eligible Counterparties as defined by MiFID II and is not intended for use by retail customers or for any persons or entities in any jurisdictions or country where such distribution or use would be contrary to local law or regulation.
This material is not a product of Santander´s Research Team and does not constitute independent investment research. This is a marketing communication and may contain ¨investment recommendations¨ as defined by the Market Abuse Regulation 596/2014 ("MAR"). This publication has not been prepared in accordance with legal requirements designed to promote the independence of research and is not subject to any prohibition on dealing ahead of the dissemination of investment research. The author, date and time of the production of this publication are as indicated herein.
This publication does not constitute investment advice and may not be relied upon to form an investment decision, nor should it be construed as any offer to sell or issue or invitation to purchase, acquire or subscribe for any instruments referred herein. The publication has been prepared in good faith and based on information Santander considers reliable as of the date of publication, but Santander does not guarantee or represent, express or implied, that such information is accurate or complete. All estimates, forecasts and opinions are current as at the date of this publication and are subject to change without notice. Unless otherwise indicated, Santander does not intend to update this publication. The views and commentary in this publication may not be objective or independent of the interests of the Trading and Sales functions of Santander, who may be active participants in the markets, investments or strategies referred to herein and/or may receive compensation from investment banking and non-investment banking services from entities mentioned herein. Santander may trade as principal, make a market or hold positions in instruments (or related derivatives) and/or hold financial interest in entities discussed herein. Santander may provide market commentary or trading strategies to other clients or engage in transactions which may differ from views expressed herein. Santander may have acted upon the contents of this publication prior to you having received it.
This publication is intended for the exclusive use of the recipient and must not be reproduced, redistributed or transmitted, in whole or in part, without Santander’s consent. The recipient agrees to keep confidential at all times information contained herein.


