Uncategorized
CRE exposure vs corporate credit in BBBs
admin | November 22, 2019
This material is a Marketing Communication and does not constitute Independent Investment Research.
The ‘BBB’ sector of the investment universe continues to draw significant scrutiny as investors evaluate economic scenarios and begin making allocation decisions for 2020. A base case of globally low interest rates amid softening economic growth has sharpened the focus among investors reaching for yield on the lower tier of investment grade products. The wide dispersion of yields available across the ‘BBB’ universe of senior unsecured corporate debt versus commercial mortgage-backed securities clearly indicate that ratings are only capturing part of the market’s assessment of risk.
Compensation for risk varies considerably across products that have similar ratings (Exhibit 1). The average yield for ‘BBB’ senior unsecured corporate credit is currently lower than arguably the cleanest equivalently-rated CMBS collateral – the B and C classes of Freddie Mac K-deals. Even when equivalently-rated, the C classes typically have higher yields than the B’s, reflecting the lower level of credit support in the waterfall structure.
Exhibit 1: Yields available across ‘BBB’ corporate credit versus CMBS
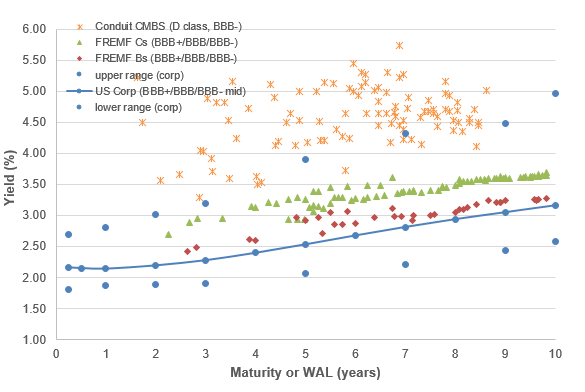
Note: Data only includes conduit CMBS D classes which are rated Baa3/BBB- by at least two rating agencies and those ratings are not mixed. The Bloomberg Barclays Corporate credit BBB+/BBB/BBB- curve (BS75) includes issuers that have mixed ratings, and the mid curve is a weighted average yield of all bonds outstanding in the category. All yields are from BVAL on Bloomberg. Source: Bloomberg, Amherst Pierpont Securities
However, yields for both B and C classes of Freddie K-deals that are ‘BBB’ rated currently lie well within the upper half of the range of yields for ‘BBB’ corporate credit. This is likely a reflection of the tendency for upwards ratings migration of the B and C classes as loans are defeased over time, and the extraordinarily low delinquency and loss rates – less than 6 bp and 1 bp of outstanding principal balance, respectively – in the K-deal program.
Conduit CMBS D classes rated BBB- predominantly offer yields higher than equivalently rated corporate debt and Freddie B and C classes across the maturity spectrum. The range of yields available reflects factors such as the diversity of underlying collateral, the thickness of the tranche and the credit protection provided by the rest of the structure.
Relative spreads between CMBS and investment grade corporates
The historical performance of IG corporates and CMBS does tend to trend together (Exhibit 2) during periods of broad market moves, including the late 2018 risk-off move followed by the sustained rally in rates and most spread products through much of 2019. There have also been periods where performances have deviated due to particular events in corporate credit in 2013-2015 that tended to provoke less volatility in CMBS. If the CMBS ETF covered the financial crisis, it’s almost certain that the positions would be reversed, with the IG corporate index showing overall less volatility during a period when CMBS defaults hit record highs.
Exhibit 2: Performance of IG corporate bonds vs CMBS
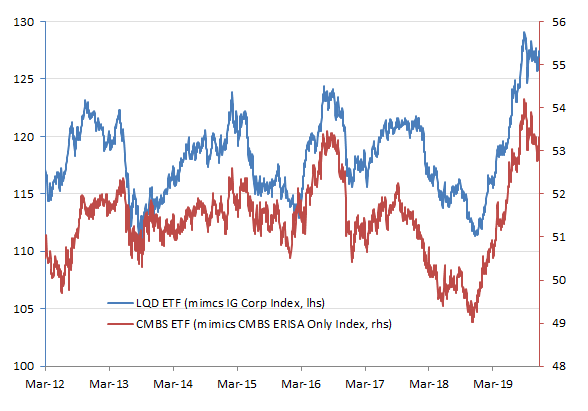
Note: iShares exchange-traded funds LQD and CMBS are designed to mimic the price and yield performance of the US Dollar Investment Grade Corporate Bond Index and the Bloomberg Barclays US CMBS (ERISA Only) Index. Daily data since 3/1/2012; CMBS ETF began trading in February 2012. Source: Bloomberg, Amherst Pierpont Securities.
Although both LQD and the CMBS ETFs are constructed from the broader investment grade universe of bonds, it’s possible to infer that a ‘BBB’-specific index in both sectors would show similar performance with greater volatility. Spread volatility generally tends to increase as ratings decrease, and particularly so during periods of sharp market corrections.
The questions investors may need to ask themselves for 2020 when making allocation decisions between corporate and CRE, is how stable they believe the fundamentals of each sector is and whether they suspect the next economic downdraft will emanate from equities or real estate.
This material is intended only for institutional investors and does not carry all of the independence and disclosure standards of retail debt research reports. In the preparation of this material, the author may have consulted or otherwise discussed the matters referenced herein with one or more of SCM’s trading desks, any of which may have accumulated or otherwise taken a position, long or short, in any of the financial instruments discussed in or related to this material. Further, SCM may act as a market maker or principal dealer and may have proprietary interests that differ or conflict with the recipient hereof, in connection with any financial instrument discussed in or related to this material.
This message, including any attachments or links contained herein, is subject to important disclaimers, conditions, and disclosures regarding Electronic Communications, which you can find at https://portfolio-strategy.apsec.com/sancap-disclaimers-and-disclosures.
Important Disclaimers
Copyright © 2026 Santander US Capital Markets LLC and its affiliates (“SCM”). All rights reserved. SCM is a member of FINRA and SIPC. This material is intended for limited distribution to institutions only and is not publicly available. Any unauthorized use or disclosure is prohibited.
In making this material available, SCM (i) is not providing any advice to the recipient, including, without limitation, any advice as to investment, legal, accounting, tax and financial matters, (ii) is not acting as an advisor or fiduciary in respect of the recipient, (iii) is not making any predictions or projections and (iv) intends that any recipient to which SCM has provided this material is an “institutional investor” (as defined under applicable law and regulation, including FINRA Rule 4512 and that this material will not be disseminated, in whole or part, to any third party by the recipient.
The author of this material is an economist, desk strategist or trader. In the preparation of this material, the author may have consulted or otherwise discussed the matters referenced herein with one or more of SCM’s trading desks, any of which may have accumulated or otherwise taken a position, long or short, in any of the financial instruments discussed in or related to this material. Further, SCM or any of its affiliates may act as a market maker or principal dealer and may have proprietary interests that differ or conflict with the recipient hereof, in connection with any financial instrument discussed in or related to this material.
This material (i) has been prepared for information purposes only and does not constitute a solicitation or an offer to buy or sell any securities, related investments or other financial instruments, (ii) is neither research, a “research report” as commonly understood under the securities laws and regulations promulgated thereunder nor the product of a research department, (iii) or parts thereof may have been obtained from various sources, the reliability of which has not been verified and cannot be guaranteed by SCM, (iv) should not be reproduced or disclosed to any other person, without SCM’s prior consent and (v) is not intended for distribution in any jurisdiction in which its distribution would be prohibited.
In connection with this material, SCM (i) makes no representation or warranties as to the appropriateness or reliance for use in any transaction or as to the permissibility or legality of any financial instrument in any jurisdiction, (ii) believes the information in this material to be reliable, has not independently verified such information and makes no representation, express or implied, with regard to the accuracy or completeness of such information, (iii) accepts no responsibility or liability as to any reliance placed, or investment decision made, on the basis of such information by the recipient and (iv) does not undertake, and disclaims any duty to undertake, to update or to revise the information contained in this material.
Unless otherwise stated, the views, opinions, forecasts, valuations, or estimates contained in this material are those solely of the author, as of the date of publication of this material, and are subject to change without notice. The recipient of this material should make an independent evaluation of this information and make such other investigations as the recipient considers necessary (including obtaining independent financial advice), before transacting in any financial market or instrument discussed in or related to this material.
Important disclaimers for clients in the EU and UK
This publication has been prepared by Trading Desk Strategists within the Sales and Trading functions of Santander US Capital Markets LLC (“SanCap”), the US registered broker-dealer of Santander Corporate & Investment Banking. This communication is distributed in the EEA by Banco Santander S.A., a credit institution registered in Spain and authorised and regulated by the Bank of Spain and the CNMV. Any EEA recipient of this communication that would like to affect any transaction in any security or issuer discussed herein should do so with Banco Santander S.A. or any of its affiliates (together “Santander”). This communication has been distributed in the UK by Banco Santander, S.A.’s London branch, authorised by the Bank of Spain and subject to regulatory oversight on certain matters by the Financial Conduct Authority (FCA) and the Prudential Regulation Authority (PRA).
The publication is intended for exclusive use for Professional Clients and Eligible Counterparties as defined by MiFID II and is not intended for use by retail customers or for any persons or entities in any jurisdictions or country where such distribution or use would be contrary to local law or regulation.
This material is not a product of Santander´s Research Team and does not constitute independent investment research. This is a marketing communication and may contain ¨investment recommendations¨ as defined by the Market Abuse Regulation 596/2014 ("MAR"). This publication has not been prepared in accordance with legal requirements designed to promote the independence of research and is not subject to any prohibition on dealing ahead of the dissemination of investment research. The author, date and time of the production of this publication are as indicated herein.
This publication does not constitute investment advice and may not be relied upon to form an investment decision, nor should it be construed as any offer to sell or issue or invitation to purchase, acquire or subscribe for any instruments referred herein. The publication has been prepared in good faith and based on information Santander considers reliable as of the date of publication, but Santander does not guarantee or represent, express or implied, that such information is accurate or complete. All estimates, forecasts and opinions are current as at the date of this publication and are subject to change without notice. Unless otherwise indicated, Santander does not intend to update this publication. The views and commentary in this publication may not be objective or independent of the interests of the Trading and Sales functions of Santander, who may be active participants in the markets, investments or strategies referred to herein and/or may receive compensation from investment banking and non-investment banking services from entities mentioned herein. Santander may trade as principal, make a market or hold positions in instruments (or related derivatives) and/or hold financial interest in entities discussed herein. Santander may provide market commentary or trading strategies to other clients or engage in transactions which may differ from views expressed herein. Santander may have acted upon the contents of this publication prior to you having received it.
This publication is intended for the exclusive use of the recipient and must not be reproduced, redistributed or transmitted, in whole or in part, without Santander’s consent. The recipient agrees to keep confidential at all times information contained herein.


