


Uncategorized
CLO Manager Profile: Steele Creek
admin | November 22, 2019
This material is a Marketing Communication and does not constitute Independent Investment Research.
CLO manager Steele Creek has generally produced good returns on the portfolios of leveraged loans backing its deals, typically exceeding returns on the broad loan market and returns at most competitors. But a combination of modest size and issuance and a tendency to own smaller loans with lower prices and wider spreads has left Steele Creek debt trading wide of its peers. Among CLO managers tracked by Amherst Pierpont, the firm’s history of excess return and its wide debt spreads at issuance both rank in the Top 20% (Exhibit 1).
Exhibit 1: Steele Creek BSL Long-Term Performance

Note: Asset performance ranked by manager information ratio against the S&P/LSTA index, liability spread ranked by discount margin on new issue debt relative to peers in the market at the same time. Rank as of 11/7/2019.
Portfolio performance has softened in 2019, however, and some CLO investors have stepped to the sidelines to wait for further results. Spread and capital structure make Steele Creek senior debt attractive, but recent performance suggests some caution on mezzanine debt and equity. Amherst Pierpont’s current recommendations (Exhibit 2):
Exhibit 2: APS recommendations on Steele Creek
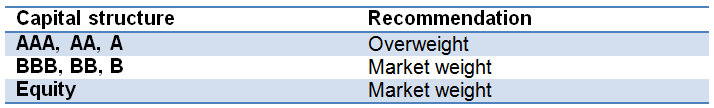
Source: Amherst Pierpont Securities
Portfolio performance
The firm, run by Chief Investment Officer Glenn Duffy and Head Portfolio Manager Matt Stouffer, currently manages $2.97 billion market value of broadly syndicated leveraged loans backing nine CLOs (Exhibit 3). According to CreditFlux as of June 2019, Steele Creek ranks 75 of 145 managers in market value of loans managed.
Exhibit 3: Steele Creek BSL CLOs
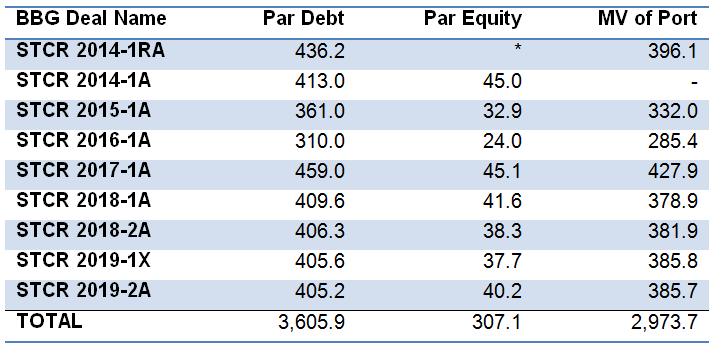
Note: Par equity for STCR 2014-1RA comes from the reset of STCR 2014-1A and the addition of $2.4 million. Source: Amherst Pierpont Securities as of Oct 7, 2019
Steele Creek portfolios historically have exceeded returns on the S&P/LSTA leveraged loan index by an average of eight basis points monthly or 96 bp annually (Exhibit 4). The average excess return, or alpha, is well above the current market median of two basis points monthly or 24 bp annually. Steele Creek’s average information ratio of 0.49, which runs well above the current market median of 0.07, suggests the team has delivered alpha in 69% of performance periods compared to the market median of 53%. Of managers tracked by Amherst Pierpont, Steele Creek ranks #38 of 149 among in average alpha and #7 of 149 in information ratio.
The firm also has generally run portfolios that track returns on the S&P/LSTA leveraged loan index with a beta of 0.88—a 1% return on the index coinciding with an average 0.88% return for Steele Creek (Exhibit 4). For deals where Amherst Pierpont has at least 18 months of accurate performance data, Steele Creek betas are reliably below the current market median of 0.96. Steele Creek’s lower average beta suggests a combination of asset allocation, loan selection, trading strategy and loan attributes that create net market risk slightly below the average of the S&P/LSTA portfolio.
Exhibit 4: Long-term loan portfolio performance on Steele Creek deals
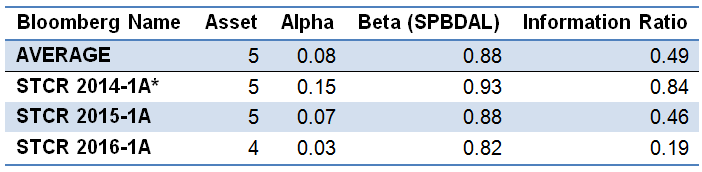
Note: Calculations only include deals with at least 18 months of return data considered accurate based on APS screening. Asset number represents quintile of performance with 5 representing the top 20% and 1 the bottom 20%. Alpha, beta and information ratio calculated against the S&P/LSTA Index. For full details on methods, contact your APS representative. Results for STCR 2014-1A reflect performance through deal reset as of 7/2018. Source: Amherst Pierpont Securities as of 11/6/2019.
Performance for the three months ending in late September and early October 2019 has fallen well below Steele Creek’s average. Total returns on the manager’s portfolios have fallen below the S&P/LSTA index. After adjusting for beta, the portfolios trail the index by an average of 33 bp (Exhibit 5).
Exhibit 5: Short-term loan portfolio performance on Steele Creek deals
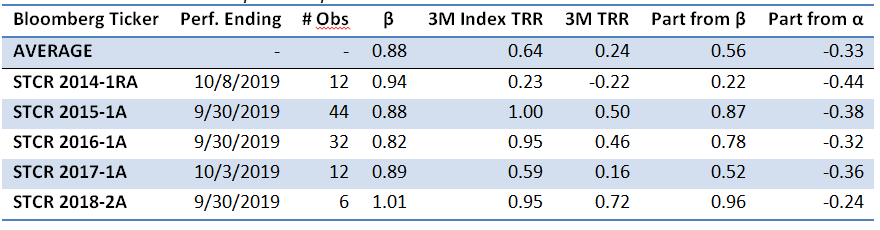
Note: Performance attribution starts with calculated total return on the leveraged loan portfolio held in each CLO for the 3-month reporting period ending on the indicated date. CLOs, even with a single manager platform, may vary in reporting period. The analysis matches performance in each period to performance over the identical period in the S&P/LSTA Leveraged Loan Index. Where a deal has at least 18 months of performance history since pricing and no apparent errors in cash flow data, the analysis calculates a deal beta. The deal beta is multiplied by the index return to predict deal return attributable to broad market performance. Where no beta can be calculated, the analysis uses the average beta across manager deals weighted by the average deal principal balance over time. Any difference between performance attributable to beta and actual performance is attributed to manager alpha. Source: Amherst Pierpont Securities.
The recent shift in performance shows both in seasoned and newer deals. For example, performance on STCR 2016-1A has shifted from generally above index returns from early 2017 through early 2019 to below index returns since then (Exhibit 6). Loan portfolio performance on the newer 2018-1A also has generally trailed the index in 2019.
Exhibit 6: Portfolio returns recently have dropped below the S&P/LSTA index
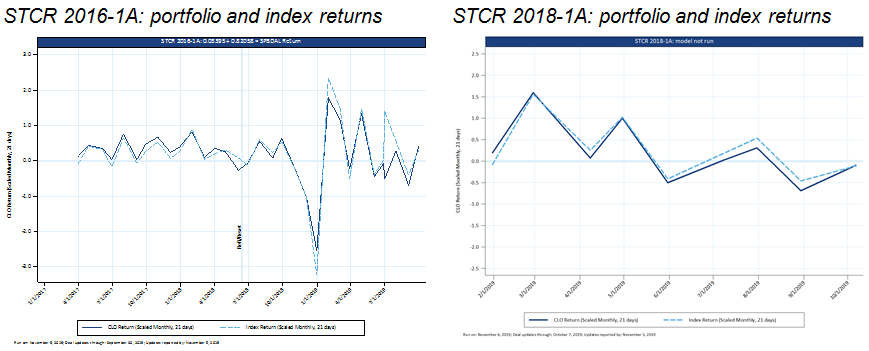
Source: Amherst Pierpont Securities
The sensitivity of Steele Creek’s portfolios partly reflects an underlying set of loans with a relatively low average price, moderately high spread and moderately low bid depth (Exhibit 7). Loans with lower bid depth tend to come from smaller lending facilities.
Exhibit 7: Steele Creek portfolio loan characteristics

Note: as of 11/6/19. Source: Amherst Pierpont Securities
The management team
Performance also reflects the team around Duffy and Stouffer. The day-to-day investment team sits with the leads in Charlotte, NC, and includes 11 other professionals for a total of 13 (Exhibit 8). They get selective services from Moelis Asset Management, the firm’s controlling shareholder, including legal and compliance, human resources, information technology, finance, accounting and tax and investor relations. Chris Ryan, a managing director at Moelis, also sits on the investment committee. Deloitte LLP and Grant Thornton LLP provide auditing, US Bank and Deutsche Bank act as trustee and Wall Street Office as loan administrator.
Exhibit 8: Steele Creek day-to-day credit staff
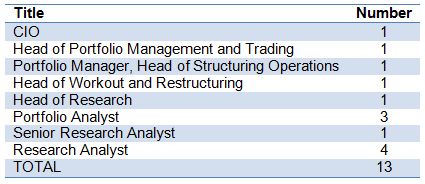
Source: Steele Creek Investment Management Manager Presentation October 2019.
The investment approach
The investment team focuses primarily on the details of individual issuers’ balance sheet and business model. Industry matters, but less than issuer details. The team may overweight or underweight an industry over time, but it does not have specific allocation targets. Because Steele Creek tends to invest in smaller and less liquid loans, it does not anticipate significant portfolio rebalancing. It tries to choose credits that will perform in both strong and weak markets. Most staff effort goes into issuer and loan analysis. The team monitors its portfolio and, between repayments and trading, turns over 60% to 70% in an average year.
The investment process usually takes a few steps:
- The Steele Creek trading desk screens the primary and secondary markets for potential strong performers. As screening turns up candidates, each gets passed on to research.
- Each candidate gets a full underwriting by one of the team’s seven credit analysts including balance sheet projections, loan structure and terms. The firm highlights expertise in 28 industries (Exhibit 9). Using a loss-in-default model, the analyst discounts projected EBIDTA to estimate first lien recoveries in default. Reports from Xtract Research identify risks in loan documents such as transfer or further leveraging of collateral, EBITDA adjustments or ability to add more senior debt. Based on results of the review and value relative to existing or alternative investments, the analyst may recommend an allocation to the loan, with neutral ranging between 75 bp to 100 bp of the portfolio.
Exhibit 9: Industries with assigned Steele Creek credit analysts

Source: Steele Creek Investment Management Manager Presentation October 2019.
- The investment committee of Duffy, Stouffer and Ryan reviews analyst results. Unanimous approval puts the loan on a buy list.
- Portfolio management integrates loans from the buy list into the CLO portfolios as loans become available.
- Portfolio management will sell positions if it finds better relative value in another loan or if news on the issuer changes the team’s opinion; a credit analyst can also put a hold on a name, stopping portfolio management from adding to issuer exposure.
- Risk management includes a quarterly industry review, a monthly review of loans trading at stressed or distressed spreads and regular review of ‘B3’ loans.
Steele Creek’s lead shareholder, Moelis, invests in each deal’s equity.
Strengths and weaknesses as a going concern
The team sees competitive advantage in its willingness and ability to invest in smaller, more complex credits. It looks for compensating yield premium and better structure on those loans. It consequently sees more of these loans than other managers, often early in the syndication process, although it has noticed rising competition for these loans in 2017 and 2018.
Steele Creek also sees its infrastructure and equity support from Moelis as an advantage.
Disadvantages include its small size, according to management, and the need to broaden distribution of its ‘AAA’ debt.
The firm expects to continue building and diversifying its business. It budgets to issue three CLOs annually. It has added a separate account mandate, and manages $225 million of market value in leveraged credit outside of CLOs.
Current views of the leveraged loan and CLO markets
Management sees the CLO market as increasingly competitive and set for some consolidation. It estimates that a manager needs at least $2.5 billion in CLO assets under management to break even depending on fees and costs. It expects many managers will be vulnerable if the incidence of stressed or distressed credit picks up.
Investing in Steele Creek debt and equity
The smaller size and lower liquidity of many loans held by Steele Creek usually help the firm deliver excess return. Higher coupons and steady pricing help in stable markets. Volatility in 2019 has hurt performance.
Steele Creek has seen spreads on all of its debt widen in the third and fourth quarter of 2019 as the S&P/LSTA leveraged loan price index has dropped and as the CLO portfolios have underperformed index total returns. Some Steele Creek ‘BB’ debt has traded much wider than peers’.
Performance on Steele Creek’s equity and most mezzanine debt should depend significantly on US growth in 2020 and on the idiosyncrasies of the names in its portfolio. Although Amherst Pierpont expects real growth to stabilize around 2%, investors may want to wait for the trend to get established in the first half of 2020 before investing below ‘BBB.’
The wide spreads on ‘AAA’, ‘AA’ and ‘A’ debt look attractive. CLO structure protects these classes from most systemic or idiosyncratic risk, and the wide spreads create compounded return advantage over time. Investors get compensated for the lower liquidity of Steele Creek’s debt, but both liquidity and spread should improve if US growth stabilizes next year.