


Uncategorized
CLO Manager Profile: 40|86 Advisors
admin | November 22, 2019
This material is a Marketing Communication and does not constitute Independent Investment Research.
CLO manager 40|86 Advisors has produced consistently good returns on the portfolios of leveraged loans backing its deals while taking relatively low risk. Its risk-adjusted returns routinely exceed the broad loan market and most competitors. The manager also operates on a large asset management platform with substantial support from CNO Financial Group, Inc., a publicly traded insurer. Despite strong performance and organization, limited issuance has left 40|86 debt trading near the market average. Among CLO managers tracked by Amherst Pierpont, the firm’s history of excess return puts it in the Top 20% while its debt spreads put it in the Middle 20% (Exhibit 1).
Exhibit 1: 40|86 BSL Long-Term Performance
![]()
Note: Asset performance ranked by manager information ratio against the S&P/LSTA index, liability spread ranked by discount margin on new issue debt relative to peers in the market at the same time. Rank as of 11/20/2019.
Portfolio performance has remained strong in 2019 despite weakness in the leveraged loan market. The manager’s tendency to hold an intentionally diversified portfolio of higher quality loans has likely insulated it from market weakness. The manager also tends to hold its own CLO equity, giving it strong incentives to take only prudent risk. Spreads on 40|86 senior debt warrant a market weighting while strong asset performance and retention of equity make mezzanine debt and equity worth overweighting. Amherst Pierpont’s current recommendations (Exhibit 2):
Exhibit 2: APS recommendations on 40|86
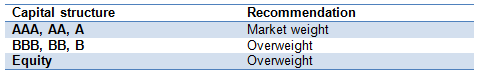
Source: Amherst Pierpont Securities
Portfolio performance
The 40|86 leveraged loan and CLO portfolio management team, run by Vice President Eddy Piedra, currently manages nearly $1.2 billion market value of broadly syndicated leveraged loans backing four US CLOs (Exhibit 3). According to CreditFlux as of June 2019, 40|86 ranks #109 of 145 managers in market value of loans managed.
Exhibit 3: 40|86 Advisors BSL CLOs
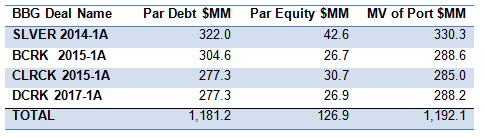
Source: Amherst Pierpont Securities as of Oct 20, 2019
The 40|86 portfolios historically have exceeded returns on the S&P/LSTA leveraged loan index by an average of four basis points monthly or 48 bp annually (Exhibit 4). The average excess return, or alpha, is above the current market median of two basis points monthly or 24 bp annually. The 40|86 average information ratio of 0.25, which runs above the current market median of 0.07, suggests the team has delivered alpha in 60% of performance periods compared to the market median of 53%. Of managers tracked by Amherst Pierpont, 40|86 ranks #65 of 150 among in average alpha but #24 of 150 in information ratio, highlighting the reliability of its excess return.
The firm also has generally run portfolios that track returns on the S&P/LSTA leveraged loan index with a relatively low beta of 0.75—a 1% return on the index coinciding with an average 0.75% return for 40|86 (Exhibit 4). For deals where Amherst Pierpont has at least 18 months of accurate performance data, the firm’s average beta is well below the current market median of 0.96 and ranks #129 of 150. The firm’s lower average beta suggests a combination of asset allocation, loan selection, trading strategy and loan attributes that create net market risk clearly below the average of the S&P/LSTA portfolio.
Exhibit 4: Long-term loan portfolio performance on 40|86 deals
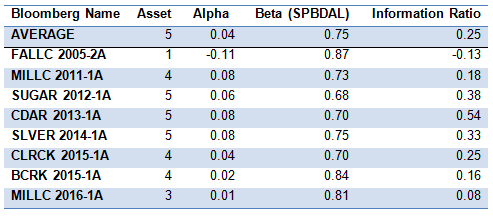
Note: Calculations only include deals with at least 18 months of return data considered accurate based on APS screening. Asset number represents quintile of performance with 5 representing the top 20% and 1 the bottom 20%. Alpha, beta and information ratio calculated against the S&P/LSTA Index. For full details on methods, contact your APS representative. Source: Amherst Pierpont Securities as of 11/20/2019.
Performance for the three months ending in late September and early October 2019 has exceeded 40|86’s average. Total returns on the manager’s active portfolios have exceeded the S&P/LSTA index. After adjusting for beta, the portfolios beat the index by an average of 42 bp (Exhibit 5). The strong performance is consistent across active deals.
Exhibit 5: Short-term loan portfolio performance on 40|86 deals
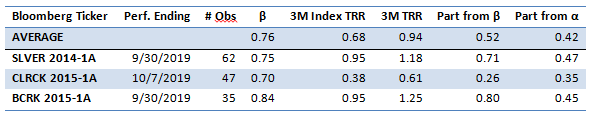
Note: Performance attribution starts with calculated total return on the leveraged loan portfolio held in each CLO for the 3-month reporting period ending on the indicated date. CLOs, even with a single manager platform, may vary in reporting period. The analysis matches performance in each period to performance over the identical period in the S&P/LSTA Leveraged Loan Index. Where a deal has at least 18 months of performance history since pricing and no apparent errors in cash flow data, the analysis calculates a deal beta. The deal beta is multiplied by the index return to predict deal return attributable to broad market performance. Where no beta can be calculated, the analysis uses the average beta across manager deals weighted by the average deal principal balance over time. Any difference between performance attributable to beta and actual performance is attributed to manager alpha. Source: Amherst Pierpont Securities.
Performance for 40|86 has been most reliable since mid-2017, when portfolio returns have generally matched or exceeded the index (Exhibit 6).
Exhibit 6: Portfolio returns have routinely beaten the S&P/LSTA index
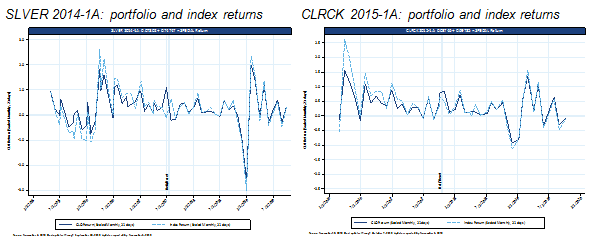
Source: Amherst Pierpont Securities
The relative low market sensitivity of 40|86 portfolios partly reflects an underlying set of loans with a relatively high average price, low weighted average rating factor, tight spread and moderately low bid depth (Exhibit 7). Loans with lower bid depth tend to come from smaller lending facilities.
Exhibit 7: 40|86 portfolio loan characteristics

Note: as of 11/21/19. Source: Amherst Pierpont Securities
The management team
The 40|86 CLO portfolio management team rolls up to Piedra and draws on the broader resources of 40|86 Advisors and the support of CNO Financial Group, Inc. The team sits in Carmel, IN, and includes 15 other portfolio management and credit professionals for a total of 16 (Exhibit 8). The larger 40|86 Advisors team provides legal and compliance, information technology and financial reporting. CNO Financial Group provides human resources, finance, accounting and tax. PriceWaterhouseCoopers provides auditing and US Bank and Wells Fargo serve as trustee, with a combination of proprietary systems and Wall Street Office providing loan administration.
CreekSource is a majority-owned affiliate of 40|86 Advisors and serves as CLO collateral manager and risk retention holder. 40|86 advises on all CreekSource CLOs.
Exhibit 8:40|86 portfolio management and credit staff
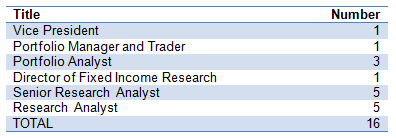
Source: CreekSource LLC Leveraged Loan and CLO Platform August 2019
The investment approach
The investment team focuses on individual issuers’ balance sheet and business model but also spends significant time benchmarking positions against the Credit Suisse Leveraged Loan Index, or CSLLI. Loan analysis focuses on the issuer’s business, industry, balance sheet and loan terms. The team has reviewed 98% of issuers in the index but approved only 34%, and has reviewed and approved only 7% of issuers coming to the market for the first time in 2019. The team benchmarks its portfolio quarterly against the index, choosing sectors to go overweight or underweight. Weightings depend in part on risk scores assigned by the analyst team to more than 100 CSLLI industry sub-sectors. Based on loan and sector risk and relative value, allocation to a name can range between 15 bp and 60 bp.
40|86’s approach reflects efforts made starting in late 2014 to consciously diversify the portfolio. The team had noticed idiosyncratic risk in outcomes for issuers such as Getty Images and Weight Watchers, among others, and studied the diversification approach of competing CLO managers before diversifying substantially. The team does not try to match the CSLLI, but exposures substantially higher or lower than the index require a clear rationale. The manager also tracks monthly total return against the CSLLI with attribution to sector allocation and security selection. If 40|86 underperforms, the team considers whether or not it wants to change allocation or selection.
The team trades roughly 10% of the portfolio in an average year, although in the 12 months ending in October it traded $300 million of $1.2 billion in CLO portfolios, including the liquidation of a CLO. Piedra describes the trading strategy as opportunistic.
The investment process usually takes a few steps:
- The 40|86 portfolio managers screen the primary and secondary markets for investment opportunities. As screening turns up candidates, each gets passed on to credit analysts.
- Each candidate gets reviewed for business model, balance sheet, industry, loan terms and relative value. The firm highlights expertise in 25 industries (Exhibit 9). Key focus goes to the ratio of free cash flow to debt, conversion of free cash flow from EBITDA, analysis of share of cash flow that is cyclical or secular, the value of the enterprise and the quality of sponsor management.
Exhibit 9: Industries with assigned 40|86 credit analysts
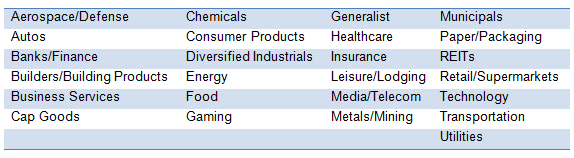
Source: CreekSource LLC Leveraged Loan and CLO Platform August 2019.
- The investment committee includes the CLO portfolio managers and the director of research. Research analysts present to the investment committee, the leveraged loan group and other research analysts and colleagues.
- All purchases and sales require approval by the two CLO portfolio managers, Piedra and Bryan Higgins.
- Risk management and credit monitoring falls largely to the research team and includes ongoing industry and issuer review of 365 leveraged loans
CreekSource LLC retains all deal equity.
Strengths and weaknesses as a going concern
The team has significant advantage in the breadth and stability of support from the larger 40|86 Advisors platform and the CNO Financial Group. The 40|86 Advisors platform, as of December 31, 2018, had $23.1 billion in assets under management across investment grade and high yield corporate debt, structured products and commercial mortgages. CreekSource provides reliable equity demand. The manager should be well positioned to issue in markets offering sufficient equity returns.
Disadvantages include limited 40|86 issuance. This limits investors’ ability to get exposure and corresponding reduces the audience and liquidity.
Current views of the leveraged loan and CLO markets
The 40|86 team is constructive about leveraged loan performance in services, manufacturing, healthcare, food and tobacco and the forest products and containers sectors. It carries notable overweight positions in those areas. In information technology, retail, energy, gaming and leisure and media and telecommunications, the team is cautious and underweight.
40|86 only issues when it sees opportunity to deliver good risk-adjusted return to equity, and the manager does not see the opportunity now. If the economy slows and spreads widen, it could step back in.
Investing in 40|86 debt and equity
Most investors recognize the generally high quality of 40|86 portfolios but may not appreciate the surprisingly low average beta of its investment approach. The low beta is especially notable given the teams careful attention to sector allocation relative to the index. Allocation across index sectors might imply a beta closer to 1.0. But the low effective beta of 40|86 likely reflects selection of high-quality names within each sector.
The low beta of 40|86 portfolios should make the manager robust to any broad weakness in leveraged loans. The good average generation of excess return also is attractive. Both should help reduce return volatility in 40|86 equity and speculative grade debt.
The average spreads on ‘AAA’, ‘AA’ and ‘A’ debt from 40|86 warrant at least a market weight position. But average spreads in ‘BBB’ and lower rated debt may not reflect the relatively lower risk of the 40|86 investment approach. Investors should get well compensated for risk at ‘BBB’ and below and should overweight those positions.