Uncategorized
Banner year for housing
admin | November 22, 2019
This material is a Marketing Communication and does not constitute Independent Investment Research.
The recovery from the housing bust of a decade ago has been slow and in some cases incomplete. Housing demand stalled late last year but has revived in 2019. In fact, housing on a number of measures has hit new highs since before the financial crisis.
Setting new post-crisis highs
Housing demand has strengthened this year. Industry sources primarily attribute the improvement in 2019 to a rise in affordability, reflecting both a drop in mortgage rates and a moderation in the pace of home price appreciation. A number of major housing indicators have hit new highs this year (Exhibit 1).
Exhibit 1: New Highs for Housing Indicators
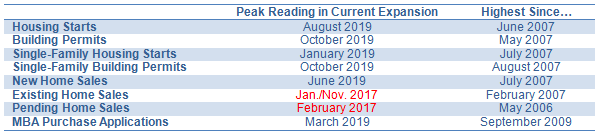
Source: Census Bureau, NAR, MBA.
Builders have cranked up their activity recently. Housing starts hit a cycle high in August, while building permits jumped to a new recent high last month. Single-family starts in October were only the third highest of the cycle but have risen for five straight months and seem likely to exceed the January high-water mark soon.
Meanwhile, new home sales exceeded 700,000 units annualized in August and September, the first such back-to-back readings since 2007, though the latest observation is somewhat below the June figure. Similarly, the Mortgage Bankers’ Association Purchase Index has achieved levels this year not seen in a decade.
The outlier in this story is existing home sales and the related pending home sales series. The NAR’s measure of resales has been improving this year but remains well off the best levels seen in 2017. A frequent refrain from NAR releases, repeated with the October data released Thursday, has been that sales have been constrained by a lack of supply. In fact, the NAR chief economist explicitly and forcefully argued in the most recent release that sales would be higher if there were more existing homes on the market.
Historical perspective
The process of recovering from the housing bust has been long and onerous. In fact, a number of key housing sector indicators arguably remain depressed by historical standards. Exhibit 2 compares current levels for key housing sector variables with the extremes of the Housing Boom and Housing Bust, as well as the 1995-2000 average. The late-1990s average could arguably represent something close to a fair value for a strong economy, though it is worth noting that the population has grown considerably over the past 20 years. In theory, housing activity should be considerably higher than it was in the late-1990s, all else equal.
Exhibit 2: Housing indicators levels
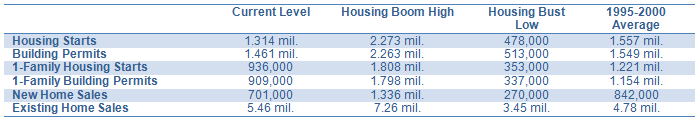
Source: Census Bureau, NAR.
Housing starts and building permits are currently running roughly halfway between the boom highs and the bust lows. The latest levels remain well below the average of the late-1990s, even though the number of households in the U.S. is up about 20% over the past 20 years.
The results are even more striking for single-family starts and permits. Multi-unit construction has been robust in the recovery years since the bust, partly because many households have decided in the wake of a steep drop in home prices during the bust that renting is better than owning. Single-family starts and permits are running 20% to 25% below the pace of the late 1990s. Indeed, as I discussed in a piece earlier this year, the pace of starts is running well below the rate of household formation, so that a shortage of available housing has developed.
In contrast, existing home sales exceeded the late-1990s pace by early in the current decade and are currently running about 15% ahead of the 1995-2000 average. In fact, this measure returned to normal just a few years after the depths of the housing bust. There are many possible explanations for the divergent performance of new and existing home sales, but one prominent one would be that prices for existing homes were so depressed by the massive foreclosure-related overhang in supply in the aftermath of the housing bust, that builders were essentially priced out of the market for a while. In other words, for a period of time, the cost of building a new home was significantly higher than the market price for a comparable existing home, especially in depressed markets.
While that dynamic should have dissipated by now, builders widely report that the costs of new construction have risen sharply in recent years, reflecting zoning laws, environmental requirements, and, to some extent, high commodity prices. Finally, the mix appears to be normalizing somewhat this year, as new home sales have increased considerably, while existing home sales are flat (year-to-date average vs. 2018 average), constrained by tight inventories.
There are many different ways to interpret the data in these exhibits. From a broad, macroeconomic perspective, my primary takeaway is that the behavior of the housing sector has been far different in this expansion than in prior business cycles. Typically, housing is one of the first sectors to turn up in a recovery and down in a recession, and the magnitude of cyclical swings has historically been steep. Coming out of the housing bust, there were many structural impediments to a violent housing recovery. In addition, builders were undoubtedly in a “once bitten, twice shy” mode. Thus, in the current business cycle, the housing sector has played more of a “tortoise” role than the traditional “hare” pattern. The good news in this is that the housing sector, even more than a decade into the current expansion, does not appear to exhibit the typical strains and excesses one might normally expect after such a long cycle. In fact, there is arguably plenty of headroom, so that, if the underlying fundamentals for demand remain robust, housing activity can continue to advance for some time.
This material is intended only for institutional investors and does not carry all of the independence and disclosure standards of retail debt research reports. In the preparation of this material, the author may have consulted or otherwise discussed the matters referenced herein with one or more of SCM’s trading desks, any of which may have accumulated or otherwise taken a position, long or short, in any of the financial instruments discussed in or related to this material. Further, SCM may act as a market maker or principal dealer and may have proprietary interests that differ or conflict with the recipient hereof, in connection with any financial instrument discussed in or related to this material.
This message, including any attachments or links contained herein, is subject to important disclaimers, conditions, and disclosures regarding Electronic Communications, which you can find at https://portfolio-strategy.apsec.com/sancap-disclaimers-and-disclosures.
Important Disclaimers
Copyright © 2026 Santander US Capital Markets LLC and its affiliates (“SCM”). All rights reserved. SCM is a member of FINRA and SIPC. This material is intended for limited distribution to institutions only and is not publicly available. Any unauthorized use or disclosure is prohibited.
In making this material available, SCM (i) is not providing any advice to the recipient, including, without limitation, any advice as to investment, legal, accounting, tax and financial matters, (ii) is not acting as an advisor or fiduciary in respect of the recipient, (iii) is not making any predictions or projections and (iv) intends that any recipient to which SCM has provided this material is an “institutional investor” (as defined under applicable law and regulation, including FINRA Rule 4512 and that this material will not be disseminated, in whole or part, to any third party by the recipient.
The author of this material is an economist, desk strategist or trader. In the preparation of this material, the author may have consulted or otherwise discussed the matters referenced herein with one or more of SCM’s trading desks, any of which may have accumulated or otherwise taken a position, long or short, in any of the financial instruments discussed in or related to this material. Further, SCM or any of its affiliates may act as a market maker or principal dealer and may have proprietary interests that differ or conflict with the recipient hereof, in connection with any financial instrument discussed in or related to this material.
This material (i) has been prepared for information purposes only and does not constitute a solicitation or an offer to buy or sell any securities, related investments or other financial instruments, (ii) is neither research, a “research report” as commonly understood under the securities laws and regulations promulgated thereunder nor the product of a research department, (iii) or parts thereof may have been obtained from various sources, the reliability of which has not been verified and cannot be guaranteed by SCM, (iv) should not be reproduced or disclosed to any other person, without SCM’s prior consent and (v) is not intended for distribution in any jurisdiction in which its distribution would be prohibited.
In connection with this material, SCM (i) makes no representation or warranties as to the appropriateness or reliance for use in any transaction or as to the permissibility or legality of any financial instrument in any jurisdiction, (ii) believes the information in this material to be reliable, has not independently verified such information and makes no representation, express or implied, with regard to the accuracy or completeness of such information, (iii) accepts no responsibility or liability as to any reliance placed, or investment decision made, on the basis of such information by the recipient and (iv) does not undertake, and disclaims any duty to undertake, to update or to revise the information contained in this material.
Unless otherwise stated, the views, opinions, forecasts, valuations, or estimates contained in this material are those solely of the author, as of the date of publication of this material, and are subject to change without notice. The recipient of this material should make an independent evaluation of this information and make such other investigations as the recipient considers necessary (including obtaining independent financial advice), before transacting in any financial market or instrument discussed in or related to this material.
Important disclaimers for clients in the EU and UK
This publication has been prepared by Trading Desk Strategists within the Sales and Trading functions of Santander US Capital Markets LLC (“SanCap”), the US registered broker-dealer of Santander Corporate & Investment Banking. This communication is distributed in the EEA by Banco Santander S.A., a credit institution registered in Spain and authorised and regulated by the Bank of Spain and the CNMV. Any EEA recipient of this communication that would like to affect any transaction in any security or issuer discussed herein should do so with Banco Santander S.A. or any of its affiliates (together “Santander”). This communication has been distributed in the UK by Banco Santander, S.A.’s London branch, authorised by the Bank of Spain and subject to regulatory oversight on certain matters by the Financial Conduct Authority (FCA) and the Prudential Regulation Authority (PRA).
The publication is intended for exclusive use for Professional Clients and Eligible Counterparties as defined by MiFID II and is not intended for use by retail customers or for any persons or entities in any jurisdictions or country where such distribution or use would be contrary to local law or regulation.
This material is not a product of Santander´s Research Team and does not constitute independent investment research. This is a marketing communication and may contain ¨investment recommendations¨ as defined by the Market Abuse Regulation 596/2014 ("MAR"). This publication has not been prepared in accordance with legal requirements designed to promote the independence of research and is not subject to any prohibition on dealing ahead of the dissemination of investment research. The author, date and time of the production of this publication are as indicated herein.
This publication does not constitute investment advice and may not be relied upon to form an investment decision, nor should it be construed as any offer to sell or issue or invitation to purchase, acquire or subscribe for any instruments referred herein. The publication has been prepared in good faith and based on information Santander considers reliable as of the date of publication, but Santander does not guarantee or represent, express or implied, that such information is accurate or complete. All estimates, forecasts and opinions are current as at the date of this publication and are subject to change without notice. Unless otherwise indicated, Santander does not intend to update this publication. The views and commentary in this publication may not be objective or independent of the interests of the Trading and Sales functions of Santander, who may be active participants in the markets, investments or strategies referred to herein and/or may receive compensation from investment banking and non-investment banking services from entities mentioned herein. Santander may trade as principal, make a market or hold positions in instruments (or related derivatives) and/or hold financial interest in entities discussed herein. Santander may provide market commentary or trading strategies to other clients or engage in transactions which may differ from views expressed herein. Santander may have acted upon the contents of this publication prior to you having received it.
This publication is intended for the exclusive use of the recipient and must not be reproduced, redistributed or transmitted, in whole or in part, without Santander’s consent. The recipient agrees to keep confidential at all times information contained herein.


