


Uncategorized
Assessing risk in multifamily credit risk transfer
admin | November 15, 2019
This material is a Marketing Communication and does not constitute Independent Investment Research.
Credit risk transfer deals are gaining in popularity – as the GSEs and now JP Morgan transfer credit exposure to investors in order to better manage capital. Fannie Mae recently expanded its credit risk transfer program from single-family to multifamily mortgages – a well-timed introduction, given the significant growth in multifamily lending over the past five years, and a significant future commitment by the FHFA and the GSEs to the sector. Investors in these transactions require both a thorough evaluation of Fannie Mae’s historical multifamily defaults and losses; and an appreciation for how differences between the reference collateral backing the new deal and Fannie’s historic multifamily book could shift those outcomes going forward.
Multifamily loan performance
To support their credit risk transfer program, Fannie Mae published a multifamily loan performance database (MLFPD) that includes records on more than 46,000 loans from January 1, 2000 through December 31, 2018. A summary of collateral and performance metrics (Exhibit 1) shows quite a bit of variability across vintages. Because a large portion of multifamily loans have original maturities from 10 to 12 years and the data currently available is only updated through year-end 2018, it’s difficult to analyze and interpret the performance of vintages later than 2008. For vintages from 2000 through 2008, the probability of a loan defaulting and incurring losses (or gains) ranged from a low of 1.4% in 2003 to a high of 5.5% in the 2007 vintage heavily affected by the financial crisis. The vintages also demonstrated a range of overall loan loss severities from a low of 14.6% in 2001 to more than 50% in 2004.
Exhibit 1: Fannie Mae multifamily loan performance data
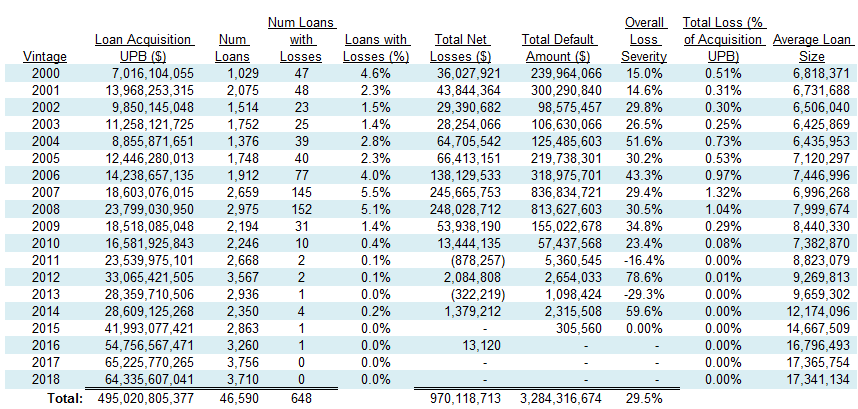
Note: Summary statistics as of year-end 2018. The loss amounts include the sum of loan balances charged off in a liquidation event, the foregone interest accrued, and net cash flow (e.g. total amount of expenses incurred, property income) used in efforts to mitigate losses on non-performing loans and REO; offset by receipt of third party loss sharing benefits and insurance claims as of the reporting period. Negative loss numbers indicate the recovery value was greater than the loss amount. Source: Fannie Mae, Amherst Pierpont Securities
Cumulative loss profiles for each vintage vary significantly over time (Exhibit 2). The financial crisis clearly had the most pronounced impact on vintages 2003 through 2008. The early vintages began accruing substantial losses 3 to 5 years in the maturity cycle, whereas the 2007 and 2008 vintages began piling up defaults in under 2 years.
Exhibit 2: Cumulative loss profiles for Fannie Mae multifamily loans by vintage
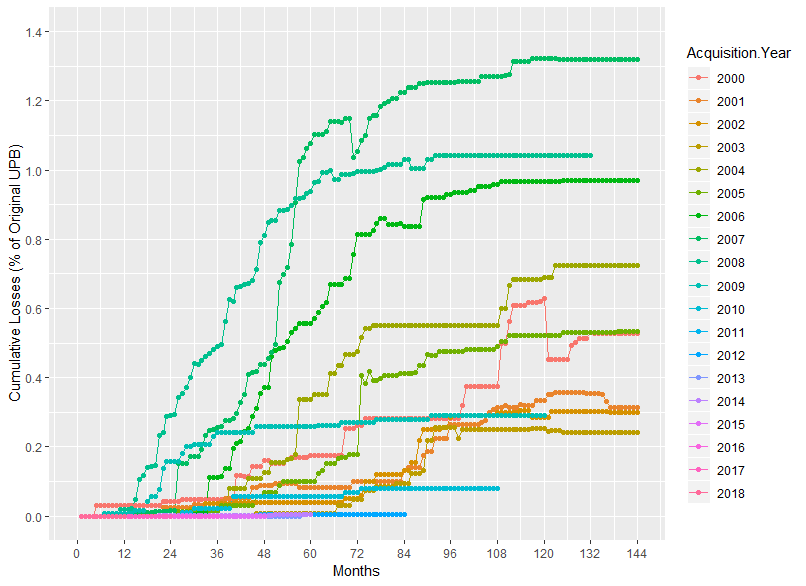
Note: Data through year-end 2018. The loss amounts include the sum of loan balances charged off in a liquidation event, the foregone interest accrued, and net cash flow (e.g. total amount of expenses incurred, property income) used in efforts to mitigate losses on non-performing loans and REO; offset by receipt of third party loss sharing benefits and insurance claims as of the reporting period. Negative loss numbers indicate the recovery value was greater than the loss amount. Source: Fannie Mae, Amherst Pierpont Securities
Comparing total losses and credit support
The total loss as a percent of the unpaid principal balance (UPB) of the pool at acquisition is one of the most important metrics for investors in credit risk transfer securities. Although cumulative loss and recovery profiles can vary somewhat over time, a CRT tranche that has initial credit support of 0.65% (Exhibit 3) would not experience any losses from a pool whose total loss percentage never rose above 0.25% to 0.51%, like the 2000 through 2003 vintages.
Exhibit 3: Structure of Fannie Mae’s MCAS 2019-01 multifamily credit risk transfer deal
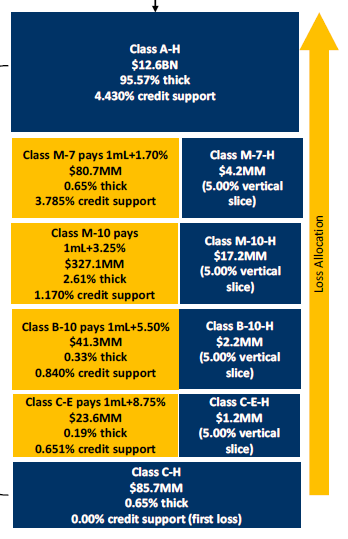
Note: The first loss piece (Class C-H, in blue), the 5% vertical slices of each tranche (in blue) and the class with the greatest credit support (A-H, in blue) were all retained by Fannie Mae. The four classes in yellow were sold to investors. Source: Fannie Mae
The thickness of the each tranche in the credit risk transfer deal is also relevant, and can vary significantly among issuers. Fannie’s multifamily loans in the 2007 and 2008 vintages have so far turned in the worst performance, with total losses of UPB of 1.32% and 1.04%, respectively. Losses of that magnitude would wipe out the principal balance of MCAS 2019-01 classes C-E and B-10, the most junior classes sold to investors. The tranches are relatively thin at 19 bp and 33 bp, and losses above 1.17% of UPB would begin eroding the M-10 class. The M-10 class is 261 bp thick, providing the highest rated M-7 class with a strong 3.785% of credit support.
Do larger loans have better performance?
Under its new multifamily CRT program, Fannie Mae is constructing reference pools using loans with principal balances of $30 million or more at origination. Among the purported reasons for this is that larger loans are taken out by more experienced, sophisticated borrowers and possibly subject to more stringent scrutiny during the underwriting process. The downstream effect should be that large loans have lower rates of default than smaller multifamily loans, and lower loss severities when they do default.
Exhibit 4: Fannie Mae multifamily loan performance data for loans ≥ $30 million
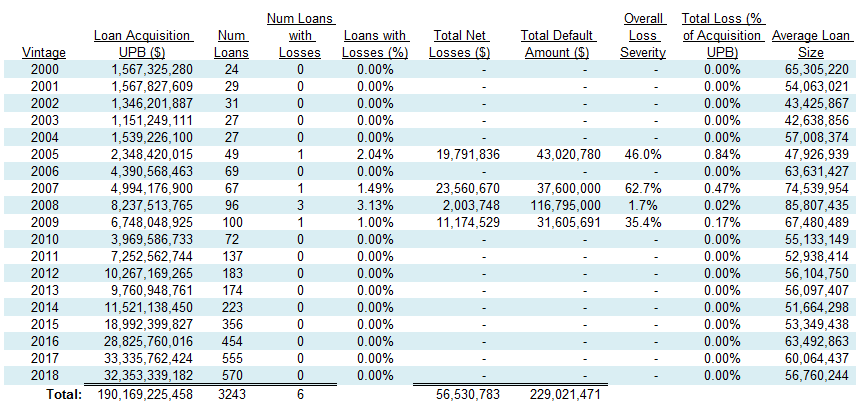
Note: Summary statistics as of year-end 2018. The loss amounts include the sum of loan balances charged off in a liquidation event, the foregone interest accrued, and net cash flow (e.g. total amount of expenses incurred, property income) used in efforts to mitigate losses on non-performing loans and REO; offset by receipt of third party loss sharing benefits and insurance claims as of the reporting period. Negative loss numbers indicate the recovery value was greater than the loss amount. Source: Fannie Mae, Amherst Pierpont Securities
Amherst Pierpont filtered Fannie Mae’s data for large loans, and recompiled the performance statistics (Exhibit 4). Extrapolating how Fannie Mae’s large loans perform as a group is more problematic than the data would make it appear. There were relatively few large loans in the 2000 to 2008 vintages, which are the most robust to analyze because they have at least 10 years of reporting data covering the period where most loans mature. This is important because commercial real estate loans tend to default later than single-family mortgages, with risk particularly concentrated around balloon payments or maturity and refinancing dates. Based on the conservative assumption that the large loans have the same probability of default as the overall pool, the number of large loans projected to default (Exhibit 5) are still very low – with less than one loan projected to default in many years. That’s consistent with the performance data of large loans.
Exhibit 5: Projected number of large loan defaults across vintages
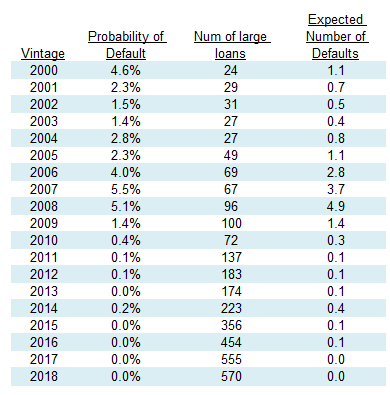
Note: Probability of default is presumed to be the default rate of the entire pool for that vintage. This is percentage of loans with losses from Exhibit 1. The expected number of defaults is the probability of default * number of large loans. Source: Fannie Mae, Amherst Pierpont Securities
The 2006-2008 vintages do have fewer large loan defaults – 0, 1 and 3, respectively – than projections of 3, 4 and 5 (rounded). That could provide some evidence that the probability of default for larger loans might be lower than that of the smaller loans. But the number of large loans is still so small relative to the default probability – that it’s difficult to comfortably evaluate the probability distribution of defaults and determine that the means of the two distributions are different. The later vintages have many more loans, and over time detailed statistical analysis can be performed, but it’s too early to draw conclusions at this time.
The loss severity data is similarly compromised – the loss severities of large loans at a glance appear higher in most years, but there are so few vintages with large loan losses that extrapolating from a handful of loans is ill advised.
So far the performance of Fannie Mae’s later vintages of multifamily loans has been impressive with very few defaults. The market environment overall has been constructive for multifamily real estate and the outlook is benign. The question for CRT investors is what can be expected during a modest or more severe downturn, which is still difficult to assess at this time.