Uncategorized
Mulling an LBO at Walgreens
admin | November 8, 2019
This material is a Marketing Communication and does not constitute Independent Investment Research.
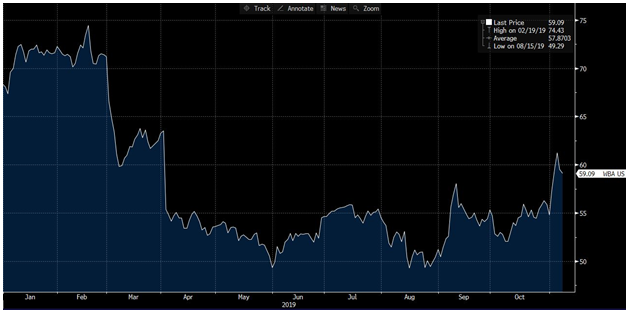
Walgreens Boots Alliance’s (WBA) stock trading was recently halted prior to headlines that the company was exploring a deal to take the company private. According to news reports, WBA is said to have held talks with Evercore Partners and KKR to vet its go-private attempt, sending shares up by mid-single digits (Exhibit 1) and bonds wider by roughly 35 bp across the curve (Exhibit 2). If the leveraged buyout is taken off the table and bond spreads re-trace to pre-LBO levels, this would be viewed as a selling opportunity for investors.
Equity weakness amid a changing landscape
Even with the jump in the equity price on the heels of the news, WBA stock is down roughly 13% year-to-date, compared to its closest investment grade (IG) peer CVS, whose stock is up nearly 9% year-to-date. WBA’s poor equity performance coupled with a dramatically changing landscape that has seemed to evolve away from traditional pharmacy brick-and-mortar and more towards a vertically integrated healthcare model are likely the underlying factors behind management’s exploration of an LBO. Furthermore, WBA’s CEO, Stefano Pessina, remains the largest shareholder with a 16.25% stake – more than double that of the next largest shareholder.
Exhibit 1. WBA equity performance year-to-date
Source: Bloomberg
Largest LBO in history?
With a market capitalization of roughly $53 billion and $16.8 billion of debt outstanding, an LBO of WBA would become the largest levered buyout in history, topping the sale of TXU to KKR /TPG for $45 billion including debt back in 2007. WBA would likely need to raise between $55-to-$65 billion to fund the take out as well as the refinancing of debt, as all bonds contain a $101 change of control (COC) put. While market conditions “appear” ripe for an LBO, given the historically low rate environment and continued demand for corporate bonds, a deal over $50 billion would be difficult to absorb in the high yield (HY) market. The HY market has not witnessed a deal larger than $20 billion, and HY spreads relative to IG spreads, have started to diverge. While the LUACTRUU index is hovering around the tights for the year, the LF98TRUU index has begun to sell off. Additionally, the HY market has not forgotten the last retail LBO, Toys R Us, which filed for Chapter 11 and then converted to a Chapter 7 case last year.
Exhibit 2. WBA 3.45% 6/1/26 spread history (8/7/19-11/7/19)
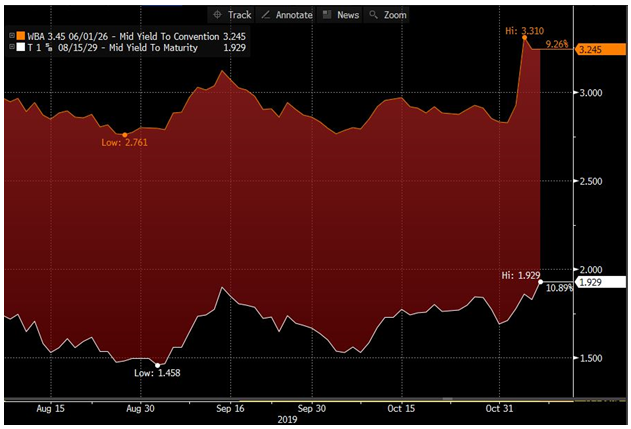
Source: Bloomberg
An LBO of a retailer is typically predicated on two reasons: real estate and cash flows. Retail LBOs have historically been used to extract value from real estate holdings that could be sold off in pieces, under the premise that the parts are worth more than the whole. Additionally the sale of real estate does not affect EBITDA profile of the company. If real estate is not the primary driver, then it’s the large and predictable cash flow base. Neither of the aforementioned factors can really be used to describe WBA. As of 8/31/19, WBA owned only 9.3% of its total store base: out of 13,882 stores in the USA and internationally, WBA only owned 1,297. While WBA has other real estate holdings such as distribution centers (13 owned out of 21), pharmaceutical distribution centers (113 owned out of 300) and principal office facilities (10 owned out of 22), these tend to carry lower valuations per square foot than commercial retail space.
From a cash flow perspective, WBA’s margins have been in decline since fiscal 2016 as the EBITDA margin has contracted from 7.1% to 5.6% currently. Additionally, cash flow/sales has deteriorated by 50% over the same time period, down from 5.6% in fiscal 2016 to 2.8% in fiscal 2019. Increased capital expenditures coupled with higher working capital needs are the primary drivers behind the cash flow decline.
What’s next?
WBA stock has sold off since the rumors hit the tape on 11/5/19, suggesting that the investment community may be skeptical that an LBO is likely. Should the company decide not to pursue an LBO, concerns remain that management may look to pursue some type of leveraged recapitalization to help lift the stock price. WBA ended the most recent fiscal year with lease adjusted leverage of 3.7x. This is high for the current Baa2/BBB ratings and up from the 3.3x posted in FY18. Adding $10 billion of debt to the balance sheet for shareholder rewards would increase leverage to the 4.5x area.
Any type of leveraged recapitalization would mark a distinct shift in financial policy and would likely result in negative rating actions. Additionally, the $101 change of control put does not protect bondholders from downside risk in a leveraged recapitalization scenario. However, if the LBO is taken off the table and spreads retrace close to pre-LBO headline trading levels, that would be viewed as a better selling opportunity .
This material is intended only for institutional investors and does not carry all of the independence and disclosure standards of retail debt research reports. In the preparation of this material, the author may have consulted or otherwise discussed the matters referenced herein with one or more of SCM’s trading desks, any of which may have accumulated or otherwise taken a position, long or short, in any of the financial instruments discussed in or related to this material. Further, SCM may act as a market maker or principal dealer and may have proprietary interests that differ or conflict with the recipient hereof, in connection with any financial instrument discussed in or related to this material.
This message, including any attachments or links contained herein, is subject to important disclaimers, conditions, and disclosures regarding Electronic Communications, which you can find at https://portfolio-strategy.apsec.com/sancap-disclaimers-and-disclosures.
Important Disclaimers
Copyright © 2026 Santander US Capital Markets LLC and its affiliates (“SCM”). All rights reserved. SCM is a member of FINRA and SIPC. This material is intended for limited distribution to institutions only and is not publicly available. Any unauthorized use or disclosure is prohibited.
In making this material available, SCM (i) is not providing any advice to the recipient, including, without limitation, any advice as to investment, legal, accounting, tax and financial matters, (ii) is not acting as an advisor or fiduciary in respect of the recipient, (iii) is not making any predictions or projections and (iv) intends that any recipient to which SCM has provided this material is an “institutional investor” (as defined under applicable law and regulation, including FINRA Rule 4512 and that this material will not be disseminated, in whole or part, to any third party by the recipient.
The author of this material is an economist, desk strategist or trader. In the preparation of this material, the author may have consulted or otherwise discussed the matters referenced herein with one or more of SCM’s trading desks, any of which may have accumulated or otherwise taken a position, long or short, in any of the financial instruments discussed in or related to this material. Further, SCM or any of its affiliates may act as a market maker or principal dealer and may have proprietary interests that differ or conflict with the recipient hereof, in connection with any financial instrument discussed in or related to this material.
This material (i) has been prepared for information purposes only and does not constitute a solicitation or an offer to buy or sell any securities, related investments or other financial instruments, (ii) is neither research, a “research report” as commonly understood under the securities laws and regulations promulgated thereunder nor the product of a research department, (iii) or parts thereof may have been obtained from various sources, the reliability of which has not been verified and cannot be guaranteed by SCM, (iv) should not be reproduced or disclosed to any other person, without SCM’s prior consent and (v) is not intended for distribution in any jurisdiction in which its distribution would be prohibited.
In connection with this material, SCM (i) makes no representation or warranties as to the appropriateness or reliance for use in any transaction or as to the permissibility or legality of any financial instrument in any jurisdiction, (ii) believes the information in this material to be reliable, has not independently verified such information and makes no representation, express or implied, with regard to the accuracy or completeness of such information, (iii) accepts no responsibility or liability as to any reliance placed, or investment decision made, on the basis of such information by the recipient and (iv) does not undertake, and disclaims any duty to undertake, to update or to revise the information contained in this material.
Unless otherwise stated, the views, opinions, forecasts, valuations, or estimates contained in this material are those solely of the author, as of the date of publication of this material, and are subject to change without notice. The recipient of this material should make an independent evaluation of this information and make such other investigations as the recipient considers necessary (including obtaining independent financial advice), before transacting in any financial market or instrument discussed in or related to this material.
Important disclaimers for clients in the EU and UK
This publication has been prepared by Trading Desk Strategists within the Sales and Trading functions of Santander US Capital Markets LLC (“SanCap”), the US registered broker-dealer of Santander Corporate & Investment Banking. This communication is distributed in the EEA by Banco Santander S.A., a credit institution registered in Spain and authorised and regulated by the Bank of Spain and the CNMV. Any EEA recipient of this communication that would like to affect any transaction in any security or issuer discussed herein should do so with Banco Santander S.A. or any of its affiliates (together “Santander”). This communication has been distributed in the UK by Banco Santander, S.A.’s London branch, authorised by the Bank of Spain and subject to regulatory oversight on certain matters by the Financial Conduct Authority (FCA) and the Prudential Regulation Authority (PRA).
The publication is intended for exclusive use for Professional Clients and Eligible Counterparties as defined by MiFID II and is not intended for use by retail customers or for any persons or entities in any jurisdictions or country where such distribution or use would be contrary to local law or regulation.
This material is not a product of Santander´s Research Team and does not constitute independent investment research. This is a marketing communication and may contain ¨investment recommendations¨ as defined by the Market Abuse Regulation 596/2014 ("MAR"). This publication has not been prepared in accordance with legal requirements designed to promote the independence of research and is not subject to any prohibition on dealing ahead of the dissemination of investment research. The author, date and time of the production of this publication are as indicated herein.
This publication does not constitute investment advice and may not be relied upon to form an investment decision, nor should it be construed as any offer to sell or issue or invitation to purchase, acquire or subscribe for any instruments referred herein. The publication has been prepared in good faith and based on information Santander considers reliable as of the date of publication, but Santander does not guarantee or represent, express or implied, that such information is accurate or complete. All estimates, forecasts and opinions are current as at the date of this publication and are subject to change without notice. Unless otherwise indicated, Santander does not intend to update this publication. The views and commentary in this publication may not be objective or independent of the interests of the Trading and Sales functions of Santander, who may be active participants in the markets, investments or strategies referred to herein and/or may receive compensation from investment banking and non-investment banking services from entities mentioned herein. Santander may trade as principal, make a market or hold positions in instruments (or related derivatives) and/or hold financial interest in entities discussed herein. Santander may provide market commentary or trading strategies to other clients or engage in transactions which may differ from views expressed herein. Santander may have acted upon the contents of this publication prior to you having received it.
This publication is intended for the exclusive use of the recipient and must not be reproduced, redistributed or transmitted, in whole or in part, without Santander’s consent. The recipient agrees to keep confidential at all times information contained herein.


