Uncategorized
Inflation’s sticky situation
admin | November 8, 2019
This material is a Marketing Communication and does not constitute Independent Investment Research.
There are a million and one different ways to parse the inflation data. Headline inflation, core inflation, trimmed mean and the list goes on. The tea leaves of inflation also fall into categories based on how often a particular item changes price. It turns out that categories with relatively infrequent changes tend to offer embedded information about inflation expectations and, in turn, provide some predictive power for broad inflation.
Flexible and sticky prices
Academic economics have delved deeply into the CPI data to see how often prices actually change for all of the categories. According to one highly detailed study, the average line item changed prices once every 4.3 months. Some categories saw prices chang quite frequently, such as gasoline. Other goods and services go long stretches between price changes. For example, the study found that coin-operated laundries changed prices only about once every 6.5 years.
Economists at the Atlanta and Cleveland Fed banks have developed a systematic approach for looking at prices using this filter. Any category that registers price changes more frequently than average are considered flexible-price items and those for which prices change less frequently than average are considered sticky-price items.
Aggregating the two groups, Cleveland Fed economists found that flexible-price items, which account for roughly 98% of month-to-month volatility in the CPI, tend to be more correlated than sticky-price items with economic conditions such as labor market slack. For many sticky-price items, the costs of changing prices are substantial. Consider a soda machine. If the machine charges 50 cents for a soda and canned soda prices increase by 2%, vendors are not going to change the machine’s price to 51 cents. Rather, vendors will wait until there has been a substantial price hike and then raise the price, perhaps to 75 cents. In contrast, gasoline stations can change their prices virtually daily, with little nuisance, as pumps can be reprogrammed quite easily.
Since sticky-price items tend to see infrequent changes, the price setters for these items will take into account not only what has occurred in the past but also some sense of inflation expectations. For example, if there is a broad expectation that soda prices are likely to increase substantially, then the vendor might bump up the machine’s charge to 75 cents, even if the actual cost of a can of soda has only moved from 50 cents to 60 cents. In contrast, if soda prices are expected to remain steady for a long time, vendors may not go to the trouble of adjusting prices in their machines.
This insight suggests that a sticky-price aggregate might offer some value for predicting inflation, since it has embedded information on inflation expectations. Cleveland Fed economists found that the sticky price index did a better job than the overall CPI at forecasting inflation, and the marginal predictive benefit got bigger as the time horizon extended further into the future.
Based on this insight, Atlanta Fed economists have calculated and continue to update various flexible-price and sticky-price CPI indices as a supplement to the more popular aggregates. The latest 12-month change for the flexible-price and sticky-price aggregates are shown here.
Exhibit 1: 12-Month Change in flexible-price and sticky-price CPI
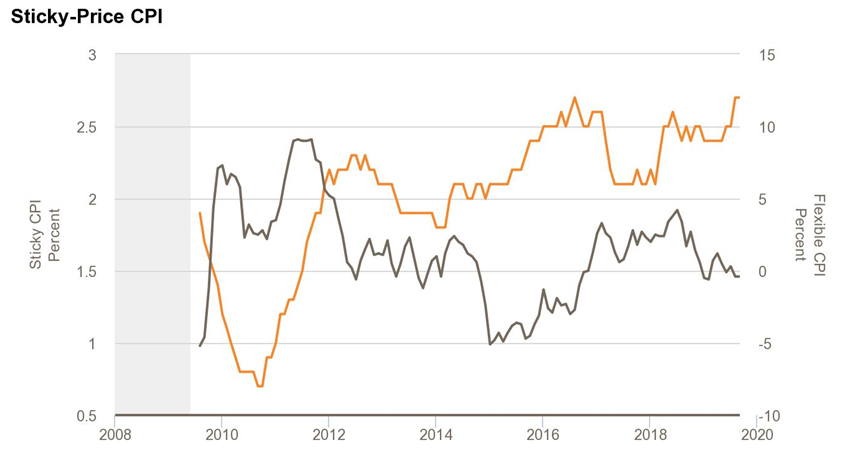
Source: Federal Reserve Bank of Atlanta
The flexible-price gauge (the darker line) has cooled substantially over the past year, though the bulk of the moderation reflects the drop in energy prices. The core ex-food and energy flexible price gauge has risen by 1.1% over the past 12 months, matching the highest reading since 2013 (Exhibit 2).
Exhibit 2: 12-month change in core flexible-price CPI
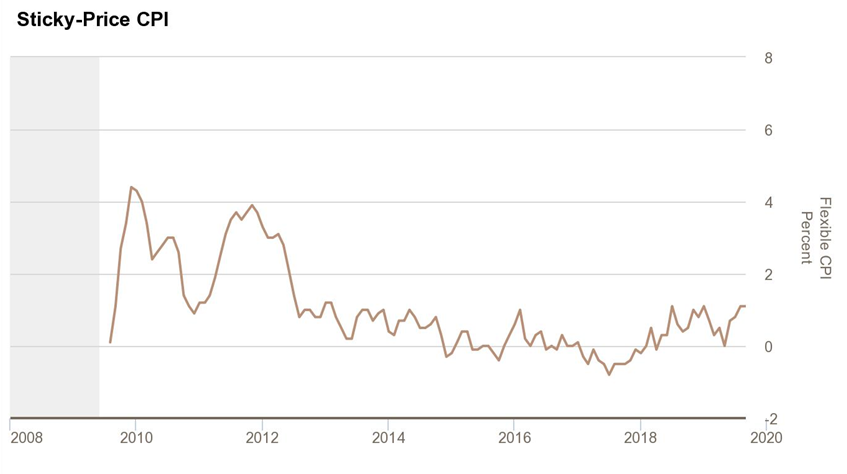
Source: Federal Reserve Bank of Atlanta
More importantly, the sticky-price CPI has crept higher over the course of 2019, reaching 2.7% in August and September, which matches the highest reading in over a decade. While the movement has not been especially large, the Atlanta Fed sticky-price gauge suggests that the underlying inflation trend may be inching up, consistent with my view that the Fed will finally see the core PCE deflator measure—and probably the headline index as well—move decisively above its 2% target in 2020. Indeed, this finding should not be particularly surprising, as virtually every major indicator of underlying inflation other than the core PCE deflator is sitting at multi-year highs.
For what it’s worth, the sticky-price framework for parsing the CPI is a more formalized version of how I have broken down and discussed the core CPI for years, pulling out what I have called the Fearsome Five (apparel, new and used motor vehicles, hotel rates, and airfares), the five most volatile and noisy line items within the core, and looking at that grouping and the ex-Fearsome Five to get a sense of whether fluctuations in the core CPI are being driven by one or two anomalies or reflect more persistent movements. Similar to the sticky-price CPI, the core CPI ex-Fearsome Five shows a modest acceleration in recent month, which could be noise but may also be telling us something about the underlying path of price hikes.
This material is intended only for institutional investors and does not carry all of the independence and disclosure standards of retail debt research reports. In the preparation of this material, the author may have consulted or otherwise discussed the matters referenced herein with one or more of SCM’s trading desks, any of which may have accumulated or otherwise taken a position, long or short, in any of the financial instruments discussed in or related to this material. Further, SCM may act as a market maker or principal dealer and may have proprietary interests that differ or conflict with the recipient hereof, in connection with any financial instrument discussed in or related to this material.
This message, including any attachments or links contained herein, is subject to important disclaimers, conditions, and disclosures regarding Electronic Communications, which you can find at https://portfolio-strategy.apsec.com/sancap-disclaimers-and-disclosures.
Important Disclaimers
Copyright © 2026 Santander US Capital Markets LLC and its affiliates (“SCM”). All rights reserved. SCM is a member of FINRA and SIPC. This material is intended for limited distribution to institutions only and is not publicly available. Any unauthorized use or disclosure is prohibited.
In making this material available, SCM (i) is not providing any advice to the recipient, including, without limitation, any advice as to investment, legal, accounting, tax and financial matters, (ii) is not acting as an advisor or fiduciary in respect of the recipient, (iii) is not making any predictions or projections and (iv) intends that any recipient to which SCM has provided this material is an “institutional investor” (as defined under applicable law and regulation, including FINRA Rule 4512 and that this material will not be disseminated, in whole or part, to any third party by the recipient.
The author of this material is an economist, desk strategist or trader. In the preparation of this material, the author may have consulted or otherwise discussed the matters referenced herein with one or more of SCM’s trading desks, any of which may have accumulated or otherwise taken a position, long or short, in any of the financial instruments discussed in or related to this material. Further, SCM or any of its affiliates may act as a market maker or principal dealer and may have proprietary interests that differ or conflict with the recipient hereof, in connection with any financial instrument discussed in or related to this material.
This material (i) has been prepared for information purposes only and does not constitute a solicitation or an offer to buy or sell any securities, related investments or other financial instruments, (ii) is neither research, a “research report” as commonly understood under the securities laws and regulations promulgated thereunder nor the product of a research department, (iii) or parts thereof may have been obtained from various sources, the reliability of which has not been verified and cannot be guaranteed by SCM, (iv) should not be reproduced or disclosed to any other person, without SCM’s prior consent and (v) is not intended for distribution in any jurisdiction in which its distribution would be prohibited.
In connection with this material, SCM (i) makes no representation or warranties as to the appropriateness or reliance for use in any transaction or as to the permissibility or legality of any financial instrument in any jurisdiction, (ii) believes the information in this material to be reliable, has not independently verified such information and makes no representation, express or implied, with regard to the accuracy or completeness of such information, (iii) accepts no responsibility or liability as to any reliance placed, or investment decision made, on the basis of such information by the recipient and (iv) does not undertake, and disclaims any duty to undertake, to update or to revise the information contained in this material.
Unless otherwise stated, the views, opinions, forecasts, valuations, or estimates contained in this material are those solely of the author, as of the date of publication of this material, and are subject to change without notice. The recipient of this material should make an independent evaluation of this information and make such other investigations as the recipient considers necessary (including obtaining independent financial advice), before transacting in any financial market or instrument discussed in or related to this material.
Important disclaimers for clients in the EU and UK
This publication has been prepared by Trading Desk Strategists within the Sales and Trading functions of Santander US Capital Markets LLC (“SanCap”), the US registered broker-dealer of Santander Corporate & Investment Banking. This communication is distributed in the EEA by Banco Santander S.A., a credit institution registered in Spain and authorised and regulated by the Bank of Spain and the CNMV. Any EEA recipient of this communication that would like to affect any transaction in any security or issuer discussed herein should do so with Banco Santander S.A. or any of its affiliates (together “Santander”). This communication has been distributed in the UK by Banco Santander, S.A.’s London branch, authorised by the Bank of Spain and subject to regulatory oversight on certain matters by the Financial Conduct Authority (FCA) and the Prudential Regulation Authority (PRA).
The publication is intended for exclusive use for Professional Clients and Eligible Counterparties as defined by MiFID II and is not intended for use by retail customers or for any persons or entities in any jurisdictions or country where such distribution or use would be contrary to local law or regulation.
This material is not a product of Santander´s Research Team and does not constitute independent investment research. This is a marketing communication and may contain ¨investment recommendations¨ as defined by the Market Abuse Regulation 596/2014 ("MAR"). This publication has not been prepared in accordance with legal requirements designed to promote the independence of research and is not subject to any prohibition on dealing ahead of the dissemination of investment research. The author, date and time of the production of this publication are as indicated herein.
This publication does not constitute investment advice and may not be relied upon to form an investment decision, nor should it be construed as any offer to sell or issue or invitation to purchase, acquire or subscribe for any instruments referred herein. The publication has been prepared in good faith and based on information Santander considers reliable as of the date of publication, but Santander does not guarantee or represent, express or implied, that such information is accurate or complete. All estimates, forecasts and opinions are current as at the date of this publication and are subject to change without notice. Unless otherwise indicated, Santander does not intend to update this publication. The views and commentary in this publication may not be objective or independent of the interests of the Trading and Sales functions of Santander, who may be active participants in the markets, investments or strategies referred to herein and/or may receive compensation from investment banking and non-investment banking services from entities mentioned herein. Santander may trade as principal, make a market or hold positions in instruments (or related derivatives) and/or hold financial interest in entities discussed herein. Santander may provide market commentary or trading strategies to other clients or engage in transactions which may differ from views expressed herein. Santander may have acted upon the contents of this publication prior to you having received it.
This publication is intended for the exclusive use of the recipient and must not be reproduced, redistributed or transmitted, in whole or in part, without Santander’s consent. The recipient agrees to keep confidential at all times information contained herein.


