Uncategorized
A better measure of market risk for CLO loan portfolios
admin | November 8, 2019
This material is a Marketing Communication and does not constitute Independent Investment Research.
CLO investors spend a lot of time focused on potential risk across loan portfolios even though repayments and active management can change the loan mix. The sensitivity of portfolio returns to movement in the broader loan market can be invaluable for investors trying to understand the market exposure of CLOs. Portfolio market sensitivity, or beta, highlights potential change in loan market value and CLO MVOC during market volatility. It is a better measure OF market risk than collateral attributes.
Beta measures the risk of the portfolio relative to the entire market
All loan portfolios have some amount of market exposure, but each portfolio differs. If a portfolio’s returns follow the market’s returns closely, then the portfolio shares a similar level of risk as the market. In that case, market sensitivity or beta is around 1. If portfolio returns consistently fluctuate more than the market, rising and falling more sharply, then portfolio risk is higher than market’s and beta is greater than 1. If portfolio returns are more stable than the market, then portfolio risk is comparably lower and beta is less than 1.
For CLOs, beta is crucial for anticipating changes in spreads of mezzanine tranches. If the overall market price of leveraged loans declines, the MVOC of mezzanine tranches in a CLO deal will too. Beta foretells how much MVOC will be affected. A beta of greater than 1 means the tranches will decline further in value than the market. Since spreads on these tranches will not only rise but also rise faster as MVOC falls, a higher beta can signal greater market risk. Investors should get compensated for this.
Betas for different segments of loan market match intuition about their relative riskiness
Beta does a good job of capturing the relative risk of different loans. Loans with ‘CCC’ rating are riskier than second liens, and ‘B’ loans are riskier than ‘BB’ loans. If beta truly reflects about market risk, then it should be the largest for CCC and greater for B than for BB. This analysis taps into total-returns data on such segments of the loans market (Exhibit 1) and compares their betas to common knowledge about their risk levels.
‘CCC’ loans have the highest beta of 1.54. Second-lien loans are next in line, with a beta of 1.42. This means that if LSTA index returns move down by 100 bp, then ‘CCC’ loans will fall by 154 bp and second-lien loans will fall by only 142 bp. ‘B’ loans have a beta of 1.19, which is 30% higher than the 0.84 beta of ‘BB’ loans. If the LSTA index drops by 100 bp, then ‘B’ will drop by 119 bp and ‘BB’ will drop by only 84 bp.
The case of middle market loans, with a beta of 0.65, is an interesting possible exception. Some investors may view these loans as riskier than their broadly syndicated cousins. However, middle market loans also tend to show less liquidity and prices that change less frequently. Any asset with infrequent price changes will show a relatively low beta to an index that reprices daily. That may say more about the quality of middle market loan pricing than it does about middle market loan risk.
Exhibit 1: Loan beta generally declines with loan risk
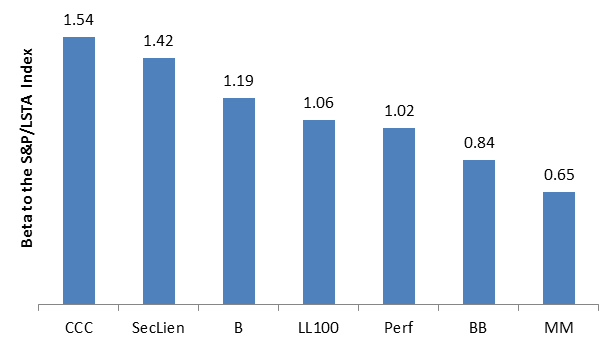
Source: S&P LSTA Loan Index, Amherst Pierpont Securities; Note: Only monthly data on total rates of return of 7 indices above and the overall LSTA market index between January 2004 and October 2019 are included. There are 190 observations for each index. Betas are coefficients found in the linear regressions of each specialized index against the market index. Each beta coefficient has high statistical significance (p-value < 0.0001) in this dataset. The higher the beta, the higher the exposure to the overall leveraged loans market.
Investors can think of portfolio beta as a blend of betas on the underlying loans. Portfolio returns over a given period is the average of returns on the underlying loans weighted by their current balances over the same period. Therefore, sensitivity of the portfolio’s returns to market’s returns is also a weighted average of the sensitivity of individual loans’ returns to market’s returns.
Today’s active CLOs can show dramatically different betas. The 1,373 CLOs tracked by Amherst Pierpont show betas that range from near zero to almost 2.0 with a median of 0.97 (Exhibit 2). Beta measures the market risk and potentially the distinct risk signature of each deal and, to the extent beta is consistent across a manager’s deals, the distinct signature of the manager.
Exhibit 2: The beta of current active CLO loan portfolios varies widely around 0.97
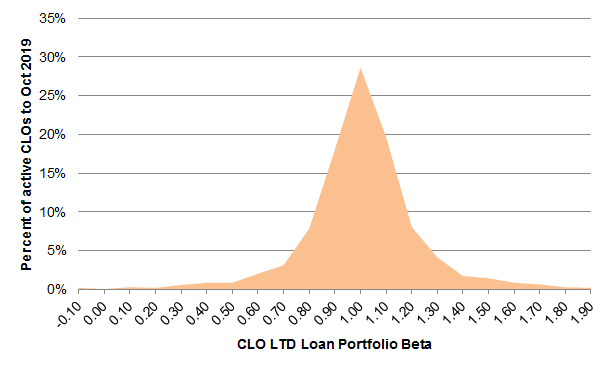
Source: Amherst Pierpont Securities
Comparing uses of collateral attributes and beta
Beta may be a better measure of market risk than the loan attributes many investors use to evaluate CLO loan portfolios. CLOs report every month on a set of collateral attributes including weighted average price, weighted average spread, weighted average rating factor and percentage of second liens, among other things. These attributes offer a valuable snapshot of risks of a CLO deal. However, the correlation between these attributes and beta is surprisingly low (Exhibit 2).
Exhibit 3: Collateral Attributes show low correlations with beta
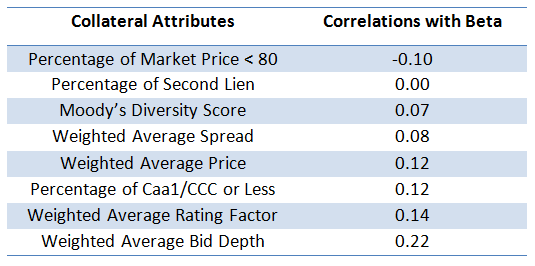
Source: Markit, Amherst Pierpont Securities. Note: Only 1,233 CLO deals observed on September 16, 2019 are included in this analysis. Correlations are between deal life-to-date beta and the indicated loan attributes as of September.
Most attributes have less than 0.15 correlations with beta. The highest correlation is 0.22, between weighted average bid depth and beta. Taking all loan attributes together, they help explain less than 20% of the betas across current active CLOs.
A few things may explain the weak link between beta and loan attributes. Among other things, these attributes are drawn from a snapshot in time, whereas beta is calculated from a history of returns. More broadly, the risk in a CLO loan portfolio relative to the market reflects manager choices about asset allocation, issuer selection, trading strategy and other things that a snapshot may not pick up.
Arguably beta and loan attributes should serve different purposes when describing portfolio risk. Investors should focus on beta to understand the average sensitivity of portfolio returns to broad shifts in the market. Beta can be invaluable for anticipating changes in MVOC and resulting spread volatility. Collateral attributes also reflect potential market risk, but inefficiently. On the other hand, loan attributes can highlight the tail of risk that might be hidden by averages—a barbell in ratings or liquidity or price, for instance. The tail of risk captures exposure to downgrades or other factors apart from market risk. That is probably the best use of loan attributes.
The uses of beta
It may be easier to hold onto existing metrics to monitor risks of a CLO portfolio, but beta might be a better candidate for the Holy Grail of market risk. While collateral attributes reflect on qualities of the underlying loans, they are less useful than beta in measuring their exposure to the market overall.
This material is intended only for institutional investors and does not carry all of the independence and disclosure standards of retail debt research reports. In the preparation of this material, the author may have consulted or otherwise discussed the matters referenced herein with one or more of SCM’s trading desks, any of which may have accumulated or otherwise taken a position, long or short, in any of the financial instruments discussed in or related to this material. Further, SCM may act as a market maker or principal dealer and may have proprietary interests that differ or conflict with the recipient hereof, in connection with any financial instrument discussed in or related to this material.
This message, including any attachments or links contained herein, is subject to important disclaimers, conditions, and disclosures regarding Electronic Communications, which you can find at https://portfolio-strategy.apsec.com/sancap-disclaimers-and-disclosures.
Important Disclaimers
Copyright © 2026 Santander US Capital Markets LLC and its affiliates (“SCM”). All rights reserved. SCM is a member of FINRA and SIPC. This material is intended for limited distribution to institutions only and is not publicly available. Any unauthorized use or disclosure is prohibited.
In making this material available, SCM (i) is not providing any advice to the recipient, including, without limitation, any advice as to investment, legal, accounting, tax and financial matters, (ii) is not acting as an advisor or fiduciary in respect of the recipient, (iii) is not making any predictions or projections and (iv) intends that any recipient to which SCM has provided this material is an “institutional investor” (as defined under applicable law and regulation, including FINRA Rule 4512 and that this material will not be disseminated, in whole or part, to any third party by the recipient.
The author of this material is an economist, desk strategist or trader. In the preparation of this material, the author may have consulted or otherwise discussed the matters referenced herein with one or more of SCM’s trading desks, any of which may have accumulated or otherwise taken a position, long or short, in any of the financial instruments discussed in or related to this material. Further, SCM or any of its affiliates may act as a market maker or principal dealer and may have proprietary interests that differ or conflict with the recipient hereof, in connection with any financial instrument discussed in or related to this material.
This material (i) has been prepared for information purposes only and does not constitute a solicitation or an offer to buy or sell any securities, related investments or other financial instruments, (ii) is neither research, a “research report” as commonly understood under the securities laws and regulations promulgated thereunder nor the product of a research department, (iii) or parts thereof may have been obtained from various sources, the reliability of which has not been verified and cannot be guaranteed by SCM, (iv) should not be reproduced or disclosed to any other person, without SCM’s prior consent and (v) is not intended for distribution in any jurisdiction in which its distribution would be prohibited.
In connection with this material, SCM (i) makes no representation or warranties as to the appropriateness or reliance for use in any transaction or as to the permissibility or legality of any financial instrument in any jurisdiction, (ii) believes the information in this material to be reliable, has not independently verified such information and makes no representation, express or implied, with regard to the accuracy or completeness of such information, (iii) accepts no responsibility or liability as to any reliance placed, or investment decision made, on the basis of such information by the recipient and (iv) does not undertake, and disclaims any duty to undertake, to update or to revise the information contained in this material.
Unless otherwise stated, the views, opinions, forecasts, valuations, or estimates contained in this material are those solely of the author, as of the date of publication of this material, and are subject to change without notice. The recipient of this material should make an independent evaluation of this information and make such other investigations as the recipient considers necessary (including obtaining independent financial advice), before transacting in any financial market or instrument discussed in or related to this material.
Important disclaimers for clients in the EU and UK
This publication has been prepared by Trading Desk Strategists within the Sales and Trading functions of Santander US Capital Markets LLC (“SanCap”), the US registered broker-dealer of Santander Corporate & Investment Banking. This communication is distributed in the EEA by Banco Santander S.A., a credit institution registered in Spain and authorised and regulated by the Bank of Spain and the CNMV. Any EEA recipient of this communication that would like to affect any transaction in any security or issuer discussed herein should do so with Banco Santander S.A. or any of its affiliates (together “Santander”). This communication has been distributed in the UK by Banco Santander, S.A.’s London branch, authorised by the Bank of Spain and subject to regulatory oversight on certain matters by the Financial Conduct Authority (FCA) and the Prudential Regulation Authority (PRA).
The publication is intended for exclusive use for Professional Clients and Eligible Counterparties as defined by MiFID II and is not intended for use by retail customers or for any persons or entities in any jurisdictions or country where such distribution or use would be contrary to local law or regulation.
This material is not a product of Santander´s Research Team and does not constitute independent investment research. This is a marketing communication and may contain ¨investment recommendations¨ as defined by the Market Abuse Regulation 596/2014 ("MAR"). This publication has not been prepared in accordance with legal requirements designed to promote the independence of research and is not subject to any prohibition on dealing ahead of the dissemination of investment research. The author, date and time of the production of this publication are as indicated herein.
This publication does not constitute investment advice and may not be relied upon to form an investment decision, nor should it be construed as any offer to sell or issue or invitation to purchase, acquire or subscribe for any instruments referred herein. The publication has been prepared in good faith and based on information Santander considers reliable as of the date of publication, but Santander does not guarantee or represent, express or implied, that such information is accurate or complete. All estimates, forecasts and opinions are current as at the date of this publication and are subject to change without notice. Unless otherwise indicated, Santander does not intend to update this publication. The views and commentary in this publication may not be objective or independent of the interests of the Trading and Sales functions of Santander, who may be active participants in the markets, investments or strategies referred to herein and/or may receive compensation from investment banking and non-investment banking services from entities mentioned herein. Santander may trade as principal, make a market or hold positions in instruments (or related derivatives) and/or hold financial interest in entities discussed herein. Santander may provide market commentary or trading strategies to other clients or engage in transactions which may differ from views expressed herein. Santander may have acted upon the contents of this publication prior to you having received it.
This publication is intended for the exclusive use of the recipient and must not be reproduced, redistributed or transmitted, in whole or in part, without Santander’s consent. The recipient agrees to keep confidential at all times information contained herein.


