Uncategorized
Playing price premiums in specified 30-year 3.0%s
admin | November 1, 2019
This material is a Marketing Communication and does not constitute Independent Investment Research.
At current mortgage rates, conventional 30-year MBS with 3.0% coupons trade above par and account for roughly 50% of current production. Finding interesting value in that flow takes some work, but some specified pools, properly hedged, qualify. Pay-ups on 30-year 3.0% pools with a loan balance story outperform hedges by a projected 7/32s to 12/32s in a 50 bp rally while hedges to the position compensate for lower pay-ups in a sell-off.
Hedging 30-year 3.0% pay-ups
Investors can buy 30-year 3.0% loan balance pools and hedge them 1:1 using FNCL 3.0% TBA. This initially leaves the pay-up unhedged—if rates rise, the pay-up will drop and could eventually approach zero. One solution is to hedge the pay-up using 5-year Treasury notes, using just enough Treasuries compensate for lower pay-ups in a sell-off.
Figuring out how pay-ups might change with rates takes some artwork. A typical approach would look at current pay-ups on the higher and lower coupons. In a 50 bp sell-off, pay-ups on 3.0%s might look like pay-ups on 2.5%s today. In a 50 bp rally, pay-ups on 3.0%s might look like pay-ups on 3.5%s today. Current data for pay-ups on 3.5%s is reliable, so this approach works for estimating pay-ups in a rally. But there is not enough specified pool trading in 2.5%s so a different approach is needed.
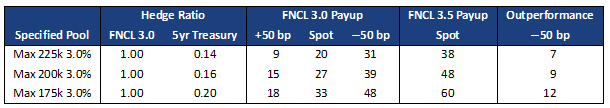
An alternative is to look at pay-ups on 3.0%s in a recent environment with higher rates. This occurred when mortgage rates were roughly 50 bp higher in March, April, and May this year. For each specified pool type, enough 5-year notes are shorted to hedge the assumed drop in pay-up. This is shown in Exhibit 1 for loan balance pools with maximum loan sizes of $175,000, $200,000, and $225,000.
Exhibit 1: 3.0% specified pools offer upside in a rally when hedging with 5-year Treasuries
Source: Amherst Pierpont Securities
For example, a Max $175k 3.0% pool is hedged 1:1 with FNCL 3.0% TBA and an additional 20% of 5-year notes. The spot pay-up is 33/32s and would drop to 18/32s—the level from earlier this year—if rates were to rise by 50 bp. On the other hand, in a rally the hedge would lose 15/32s, so the pay-up would be “owned” at 48/32s. However, the current pay-up on a Max $175k 3.5% pool is 60/32s, suggesting that the trade would make 12/32s in this rally scenario.
Pay-ups on 30-year 3.0%s look cheaper than 3.5%s
Comparing actual pay-ups to theoretical pay-ups—calculated using Yield Book’s production prepayment model—illustrates one reason this trade works. Exhibit 2 shows valuations for the three specified pool categories. In the 3.0% coupon the higher loan balance pools are trading between 40% to 50% of theoretical value, but the 3.5% pools are trading between 66% to 79% of theoretical value. This suggests that 3.0% pay-ups will become richer as rates drop, which is consistent with the view that pay-ups will outperform 5-year Treasury hedges.
Exhibit 2: Pay-ups are reasonable for call protection in 3% pools
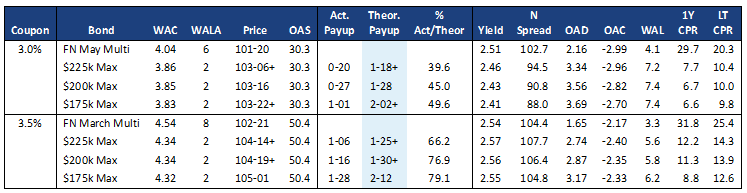
The TBA is proxied using a high gross WAC multi pool issued earlier in 2019. Each collateral story is run through the production Yield Book model at the same OAS as the corresponding TBA and the price difference to the multi pool is the theoretical pay-up. The specified pools are September issued cash window pools, with the exception of the New York pools (FN B7753 and FN BN7741). Source: Yield Book, Amherst Pierpont Securities
Pools with lower loan balances have better convexity—the loans prepay slower when rates are low and the pool is trading at a premium, and prepay faster when rates are high and the pool is trading at a discount. So these pools offer call protection and extension protection. The average loan size of 3.0% TBA pools is over $300,000 so even a loan with a $225,000 balance has a better prepayment profile than TBA.
Pool gross WACs remain lower after UMBS
The gross WACs of new pools issued under UMBS pooling standards continue to be lower than those issued in late 2018 and before June 2019 (Exhibit 3). A cap on the maximum spread between the gross WAC and pool coupon and a 50 bp cap on the amount of servicing that can be retained has eliminated incentives for originators to sell high WAC loans into low coupon pools. Most pools issued since UMBS have spreads between 85 and 95 bp.
Exhibit 3: Average spreads of new pools are better than late 2018 and early 2019
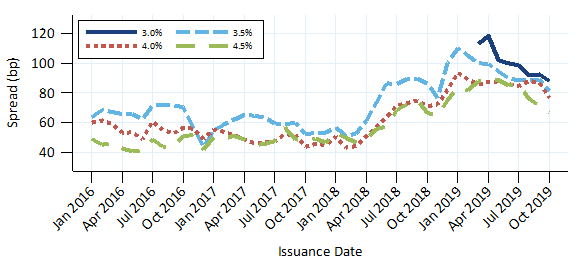
Average spread between gross WAC and coupon for GSE 30-year pools
Source: Fannie Mae, Freddie Mac, eMBS, Amherst Pierpont Securities
This material is intended only for institutional investors and does not carry all of the independence and disclosure standards of retail debt research reports. In the preparation of this material, the author may have consulted or otherwise discussed the matters referenced herein with one or more of SCM’s trading desks, any of which may have accumulated or otherwise taken a position, long or short, in any of the financial instruments discussed in or related to this material. Further, SCM may act as a market maker or principal dealer and may have proprietary interests that differ or conflict with the recipient hereof, in connection with any financial instrument discussed in or related to this material.
This message, including any attachments or links contained herein, is subject to important disclaimers, conditions, and disclosures regarding Electronic Communications, which you can find at https://portfolio-strategy.apsec.com/sancap-disclaimers-and-disclosures.
Important Disclaimers
Copyright © 2026 Santander US Capital Markets LLC and its affiliates (“SCM”). All rights reserved. SCM is a member of FINRA and SIPC. This material is intended for limited distribution to institutions only and is not publicly available. Any unauthorized use or disclosure is prohibited.
In making this material available, SCM (i) is not providing any advice to the recipient, including, without limitation, any advice as to investment, legal, accounting, tax and financial matters, (ii) is not acting as an advisor or fiduciary in respect of the recipient, (iii) is not making any predictions or projections and (iv) intends that any recipient to which SCM has provided this material is an “institutional investor” (as defined under applicable law and regulation, including FINRA Rule 4512 and that this material will not be disseminated, in whole or part, to any third party by the recipient.
The author of this material is an economist, desk strategist or trader. In the preparation of this material, the author may have consulted or otherwise discussed the matters referenced herein with one or more of SCM’s trading desks, any of which may have accumulated or otherwise taken a position, long or short, in any of the financial instruments discussed in or related to this material. Further, SCM or any of its affiliates may act as a market maker or principal dealer and may have proprietary interests that differ or conflict with the recipient hereof, in connection with any financial instrument discussed in or related to this material.
This material (i) has been prepared for information purposes only and does not constitute a solicitation or an offer to buy or sell any securities, related investments or other financial instruments, (ii) is neither research, a “research report” as commonly understood under the securities laws and regulations promulgated thereunder nor the product of a research department, (iii) or parts thereof may have been obtained from various sources, the reliability of which has not been verified and cannot be guaranteed by SCM, (iv) should not be reproduced or disclosed to any other person, without SCM’s prior consent and (v) is not intended for distribution in any jurisdiction in which its distribution would be prohibited.
In connection with this material, SCM (i) makes no representation or warranties as to the appropriateness or reliance for use in any transaction or as to the permissibility or legality of any financial instrument in any jurisdiction, (ii) believes the information in this material to be reliable, has not independently verified such information and makes no representation, express or implied, with regard to the accuracy or completeness of such information, (iii) accepts no responsibility or liability as to any reliance placed, or investment decision made, on the basis of such information by the recipient and (iv) does not undertake, and disclaims any duty to undertake, to update or to revise the information contained in this material.
Unless otherwise stated, the views, opinions, forecasts, valuations, or estimates contained in this material are those solely of the author, as of the date of publication of this material, and are subject to change without notice. The recipient of this material should make an independent evaluation of this information and make such other investigations as the recipient considers necessary (including obtaining independent financial advice), before transacting in any financial market or instrument discussed in or related to this material.
Important disclaimers for clients in the EU and UK
This publication has been prepared by Trading Desk Strategists within the Sales and Trading functions of Santander US Capital Markets LLC (“SanCap”), the US registered broker-dealer of Santander Corporate & Investment Banking. This communication is distributed in the EEA by Banco Santander S.A., a credit institution registered in Spain and authorised and regulated by the Bank of Spain and the CNMV. Any EEA recipient of this communication that would like to affect any transaction in any security or issuer discussed herein should do so with Banco Santander S.A. or any of its affiliates (together “Santander”). This communication has been distributed in the UK by Banco Santander, S.A.’s London branch, authorised by the Bank of Spain and subject to regulatory oversight on certain matters by the Financial Conduct Authority (FCA) and the Prudential Regulation Authority (PRA).
The publication is intended for exclusive use for Professional Clients and Eligible Counterparties as defined by MiFID II and is not intended for use by retail customers or for any persons or entities in any jurisdictions or country where such distribution or use would be contrary to local law or regulation.
This material is not a product of Santander´s Research Team and does not constitute independent investment research. This is a marketing communication and may contain ¨investment recommendations¨ as defined by the Market Abuse Regulation 596/2014 ("MAR"). This publication has not been prepared in accordance with legal requirements designed to promote the independence of research and is not subject to any prohibition on dealing ahead of the dissemination of investment research. The author, date and time of the production of this publication are as indicated herein.
This publication does not constitute investment advice and may not be relied upon to form an investment decision, nor should it be construed as any offer to sell or issue or invitation to purchase, acquire or subscribe for any instruments referred herein. The publication has been prepared in good faith and based on information Santander considers reliable as of the date of publication, but Santander does not guarantee or represent, express or implied, that such information is accurate or complete. All estimates, forecasts and opinions are current as at the date of this publication and are subject to change without notice. Unless otherwise indicated, Santander does not intend to update this publication. The views and commentary in this publication may not be objective or independent of the interests of the Trading and Sales functions of Santander, who may be active participants in the markets, investments or strategies referred to herein and/or may receive compensation from investment banking and non-investment banking services from entities mentioned herein. Santander may trade as principal, make a market or hold positions in instruments (or related derivatives) and/or hold financial interest in entities discussed herein. Santander may provide market commentary or trading strategies to other clients or engage in transactions which may differ from views expressed herein. Santander may have acted upon the contents of this publication prior to you having received it.
This publication is intended for the exclusive use of the recipient and must not be reproduced, redistributed or transmitted, in whole or in part, without Santander’s consent. The recipient agrees to keep confidential at all times information contained herein.


