Uncategorized
Highway spend driving strong aggregates growth
admin | November 1, 2019
This material is a Marketing Communication and does not constitute Independent Investment Research.
After strong fiscal 1H results due to robust growth in public construction demand, particularly highways, Vulcan Materials Company (VMC) remains poised to post solid 3Q results when they report on 11/6/19. State-level funding increases signed into law over the past few years have led to a 21% increase in highway starts versus two years ago, which should support continued shipment growth into transportation-related end markets and favorable aggregates pricing. Martin Marietta Materials (MLM), VMC’s closest peer, posted strong 3Q results fueled by both aggregates shipments (up 12%) and aggregates pricing (up 5%). This bodes well for VMC and could tighten intermediate bond spreads between the two companies. The VMC 3.9% 4/1/2027 is currently trading at +129 bp g-spread, 6 bp behind MLM 3.45% 6/1/2027, though these bonds traded on top of each other in late July. Furthermore, VMC trades roughly 10 bp through MLM in 5yr CDS and nearly 15 bp through MLM in the 30-year part of the curve (Exhibit 1).
Exhibit 1. VMC vs MLM curve
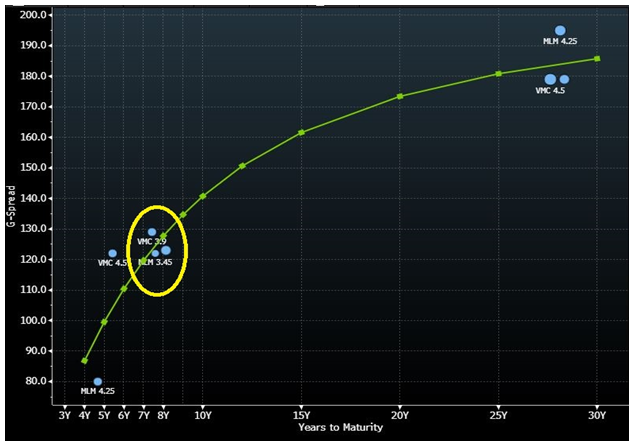
Source: Bloomberg; Amherst Pierpont Securities
An aggregates focus
VMC remains the largest aggregates producer in the United States with MLM ranked second. While similar in size from a top line perspective, VMC generates roughly 74% of its revenues from aggregates compared to 50% at MLM. While product diversification tends to be viewed more favorably, we note that when it comes to aggregates, being keenly focused on the segment is actually a benefit. The reason behind this view lies in aggregates pricing. Over the past 40 years, aggregates pricing has continued to grow regardless of where we are in the cycle. Even when demand fell nearly 34% in the most recent economic downfall, pricing continued to increase. Pricing elasticity in aggregates is due to its high barriers to entry coupled with its flexibility in production capacity. Producing aggregates is a mechanical process of crushing, thereby allowing producers to take capacity up or down very quickly at minimal cost.
Exhibit 2. Aggregate price/demand 1979-2018
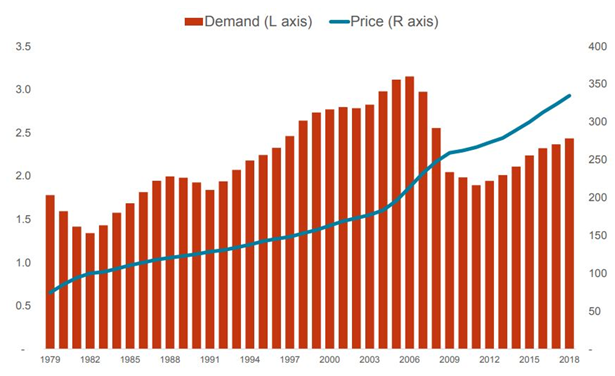
Note: Demand in billions of tons. Price is indexed (1982=100). Source: BLS and VMC estimates.
Strong state transportation funding
Aggregates continue to benefit from robust growth in public construction demand, particularly highways, driven by funding provided by the Fixing America’s Surface and Transportation Act (FAST). Furthermore, state and local funding initiatives for streets and highways are also fueling demand. As such, VMC noted at its Aggregates Day last month that the next five years could result in the highest growth rate in highway demand across VMC’s footprint in the last 30 years. Currently 85% of VMC’s revenue base is derived from eleven states. Those eleven states combined are expected to increase highway spend by 60% on average. VMC’s two largest footprint states, California and Texas, are expected to increase highway spend by 140% and 130%, respectively. These two states alone account for 31% of VMC’s top line.
Exhibit 3. VMC’s revenue footprint by state
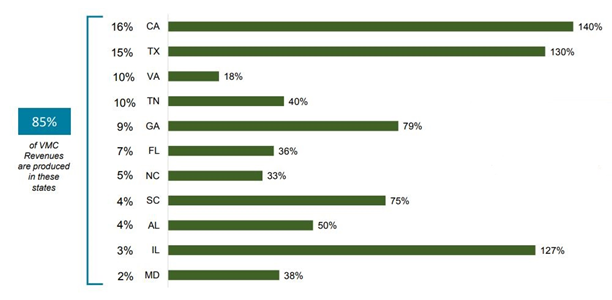
Source: VMC Aggregates Day presentation; Amherst Pierpont Securities
Leverage now within target range
Prior to being upgraded to investment grade, VMC’s leverage was 6.5x. At that time in 2Q13, VMC was rated Ba3/BB. Over the past six years, VMC has reduced leverage to 2.4x, within their 2.0x-2.5x target range; reduced overall debt outstanding and improved the structure and cost of debt to be appropriate for the company’s asset base through the cycle. The reduced leverage gives the company flexibility to fund growth as well as invest in the business. Over the aforementioned time period, VMC has improved ROIC by 770 bp, with adjusted EBITDA up 20% on CAGR basis.
Management has noted that given the cyclicality of the business, they will look to be at the lower end of their leverage target range should they begin to see the cycle turn. Leverage could decline lower than 2.4x when the company posts 3Q results due to strong EBITDA growth. Last quarter, EBITDA grew roughly 17% year-over-year and 3Q street estimates have EBITDA growth at roughly 18%. VMC’s leverage is roughly in line with MLM’s, which posted 2.3x debt/EBITDA for 3Q.
This material is intended only for institutional investors and does not carry all of the independence and disclosure standards of retail debt research reports. In the preparation of this material, the author may have consulted or otherwise discussed the matters referenced herein with one or more of SCM’s trading desks, any of which may have accumulated or otherwise taken a position, long or short, in any of the financial instruments discussed in or related to this material. Further, SCM may act as a market maker or principal dealer and may have proprietary interests that differ or conflict with the recipient hereof, in connection with any financial instrument discussed in or related to this material.
This message, including any attachments or links contained herein, is subject to important disclaimers, conditions, and disclosures regarding Electronic Communications, which you can find at https://portfolio-strategy.apsec.com/sancap-disclaimers-and-disclosures.
Important Disclaimers
Copyright © 2026 Santander US Capital Markets LLC and its affiliates (“SCM”). All rights reserved. SCM is a member of FINRA and SIPC. This material is intended for limited distribution to institutions only and is not publicly available. Any unauthorized use or disclosure is prohibited.
In making this material available, SCM (i) is not providing any advice to the recipient, including, without limitation, any advice as to investment, legal, accounting, tax and financial matters, (ii) is not acting as an advisor or fiduciary in respect of the recipient, (iii) is not making any predictions or projections and (iv) intends that any recipient to which SCM has provided this material is an “institutional investor” (as defined under applicable law and regulation, including FINRA Rule 4512 and that this material will not be disseminated, in whole or part, to any third party by the recipient.
The author of this material is an economist, desk strategist or trader. In the preparation of this material, the author may have consulted or otherwise discussed the matters referenced herein with one or more of SCM’s trading desks, any of which may have accumulated or otherwise taken a position, long or short, in any of the financial instruments discussed in or related to this material. Further, SCM or any of its affiliates may act as a market maker or principal dealer and may have proprietary interests that differ or conflict with the recipient hereof, in connection with any financial instrument discussed in or related to this material.
This material (i) has been prepared for information purposes only and does not constitute a solicitation or an offer to buy or sell any securities, related investments or other financial instruments, (ii) is neither research, a “research report” as commonly understood under the securities laws and regulations promulgated thereunder nor the product of a research department, (iii) or parts thereof may have been obtained from various sources, the reliability of which has not been verified and cannot be guaranteed by SCM, (iv) should not be reproduced or disclosed to any other person, without SCM’s prior consent and (v) is not intended for distribution in any jurisdiction in which its distribution would be prohibited.
In connection with this material, SCM (i) makes no representation or warranties as to the appropriateness or reliance for use in any transaction or as to the permissibility or legality of any financial instrument in any jurisdiction, (ii) believes the information in this material to be reliable, has not independently verified such information and makes no representation, express or implied, with regard to the accuracy or completeness of such information, (iii) accepts no responsibility or liability as to any reliance placed, or investment decision made, on the basis of such information by the recipient and (iv) does not undertake, and disclaims any duty to undertake, to update or to revise the information contained in this material.
Unless otherwise stated, the views, opinions, forecasts, valuations, or estimates contained in this material are those solely of the author, as of the date of publication of this material, and are subject to change without notice. The recipient of this material should make an independent evaluation of this information and make such other investigations as the recipient considers necessary (including obtaining independent financial advice), before transacting in any financial market or instrument discussed in or related to this material.
Important disclaimers for clients in the EU and UK
This publication has been prepared by Trading Desk Strategists within the Sales and Trading functions of Santander US Capital Markets LLC (“SanCap”), the US registered broker-dealer of Santander Corporate & Investment Banking. This communication is distributed in the EEA by Banco Santander S.A., a credit institution registered in Spain and authorised and regulated by the Bank of Spain and the CNMV. Any EEA recipient of this communication that would like to affect any transaction in any security or issuer discussed herein should do so with Banco Santander S.A. or any of its affiliates (together “Santander”). This communication has been distributed in the UK by Banco Santander, S.A.’s London branch, authorised by the Bank of Spain and subject to regulatory oversight on certain matters by the Financial Conduct Authority (FCA) and the Prudential Regulation Authority (PRA).
The publication is intended for exclusive use for Professional Clients and Eligible Counterparties as defined by MiFID II and is not intended for use by retail customers or for any persons or entities in any jurisdictions or country where such distribution or use would be contrary to local law or regulation.
This material is not a product of Santander´s Research Team and does not constitute independent investment research. This is a marketing communication and may contain ¨investment recommendations¨ as defined by the Market Abuse Regulation 596/2014 ("MAR"). This publication has not been prepared in accordance with legal requirements designed to promote the independence of research and is not subject to any prohibition on dealing ahead of the dissemination of investment research. The author, date and time of the production of this publication are as indicated herein.
This publication does not constitute investment advice and may not be relied upon to form an investment decision, nor should it be construed as any offer to sell or issue or invitation to purchase, acquire or subscribe for any instruments referred herein. The publication has been prepared in good faith and based on information Santander considers reliable as of the date of publication, but Santander does not guarantee or represent, express or implied, that such information is accurate or complete. All estimates, forecasts and opinions are current as at the date of this publication and are subject to change without notice. Unless otherwise indicated, Santander does not intend to update this publication. The views and commentary in this publication may not be objective or independent of the interests of the Trading and Sales functions of Santander, who may be active participants in the markets, investments or strategies referred to herein and/or may receive compensation from investment banking and non-investment banking services from entities mentioned herein. Santander may trade as principal, make a market or hold positions in instruments (or related derivatives) and/or hold financial interest in entities discussed herein. Santander may provide market commentary or trading strategies to other clients or engage in transactions which may differ from views expressed herein. Santander may have acted upon the contents of this publication prior to you having received it.
This publication is intended for the exclusive use of the recipient and must not be reproduced, redistributed or transmitted, in whole or in part, without Santander’s consent. The recipient agrees to keep confidential at all times information contained herein.


