


Uncategorized
The unappreciated advantage of new high SATO loans
admin | October 18, 2019
This document is intended for institutional investors and is not subject to all of the independence and disclosure standards applicable to debt research reports prepared for retail investors. This material does not constitute research.
MBS prepayment speeds have increased over the last three months in response to lower rates. Loans between six and 24 months of seasoning, and especially 6- to-12 months, have prepaid very quickly. These loans are typically easier to refinance than more seasoned loans. Lower rates have pushed these loans further in-the-money, but at the same time S-curve steepened. This is due to loans with a low spread-at-origination (SATO) and six months or more of seasoning that went in-the-money. High SATO loans, however, did not prepay as quickly. Investors buying low WALA pools can further improve convexity by selecting high SATO loans, which can be worth an additional 6/32s to 13/32s.
The S-curve appears much steeper after June
The 30-year MBS S-curve was much steeper July, August, and September than it was in May and June (Exhibit 1). The latter two months were the first to experience faster prepayments from the interest rate rally in March.
Exhibit 1: The 30-year MBS S-curve steepened throughout the summer
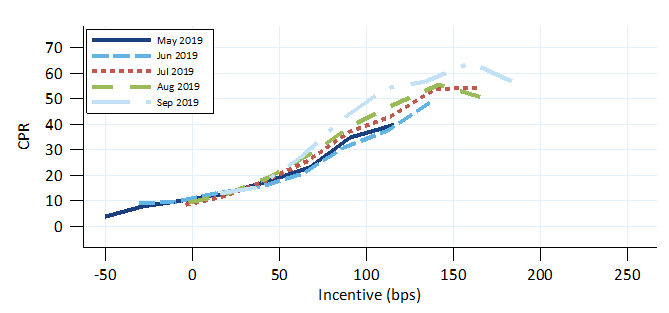
Note: June and September speeds adjusted for day count; Fannie Mae and Freddie Mac 30-year loans, 6 to 24 WALA, owner occupied, retail origination, original LTV≤80, original FICO between 725 and 800, original loan size ≥$200k. Source: Fannie Mae, Freddie Mac, eMBS, Amherst Pierpont Securities
These S-curves show speeds on loans with 6 to 24 months of seasoning, which have refinanced the quickest. These loans are particularly easy to refinance, since the existing documentation and loan appraisal from the original loan may be usable for the refinance. A variety of factors could be responsible for the steeper S-curve from July through September. To rule out these factors the S-curves only include owner occupied loans that were originated through the retail channel (no broker or correspondent lenders). Low FICO, high LTV, and low loan balance loans were also excluded. Finally an adjustment was applied to correct for the lower number of business days in June and September.
The S-curves for this controlled population steepened from May to September. For example, a loan 100 bp in-the-money prepaid at roughly 35 CPR in June and rose to roughly 50 CPR in September.
Low SATO loans refinance faster
Not all information about a loan is captured by indicators like FICO and LTV. A lender might have undisclosed reasons to assess two borrowers with the same FICO and LTV as having different levels of credit risk, and charge a higher rate to the borrower with worse credit. Comparing the note rate on a loan to the average rate of loans originated at the same time (the spread at origination, SATO) can yield additional credit information about a loan (Exhibit 2).
Exhibit 2: SATO dropped for loans ≥75 bp in-the-money

Source: Fannie Mae, Freddie Mac, eMBS, Amherst Pierpont Securities
As rates fell the number of loans with six and 24 months seasoning and at least 75 bp of rate incentive increased substantially. FICO and LTV were relatively unchanged, while loan size actually fell a little, so these factors do not explain the pickup in speeds. However, SATO dropped substantially because many of those loans were not seasoned enough prior to July. Lower SATO could explain the steeper S-curve.
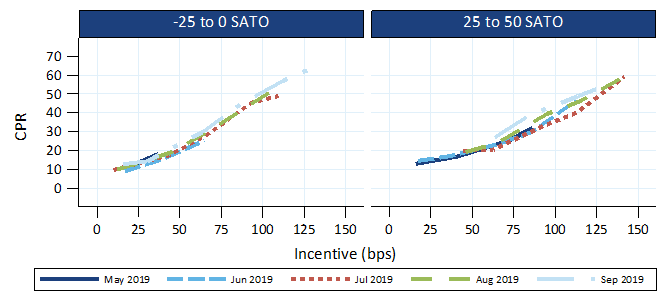
The S-curve, after controlling for SATO, did not change much across the summer months (Exhibit 3); for example, the −25 to 0 bp loans had similar S-curves across all five months. This means that the reason the overall S-curve steepened was primarily due changing composition of the most refinanceable loans—SATO fell. In May and June these in-the-money loans were high SATO, which constrained their ability to refinance—the borrowers would have faced higher than average rate, and in general high SATO borrowers have a more difficult time refinancing. But from July through September most of these borrowers had much lower SATOs, would be offered better rates, and face fewer frictions to refinance.
Exhibit 3: The S-curve for loans with similar SATO did not change over the summer
Source: Fannie Mae, Freddie Mac, eMBS, Amherst Pierpont Securities
Value in high SATO pools
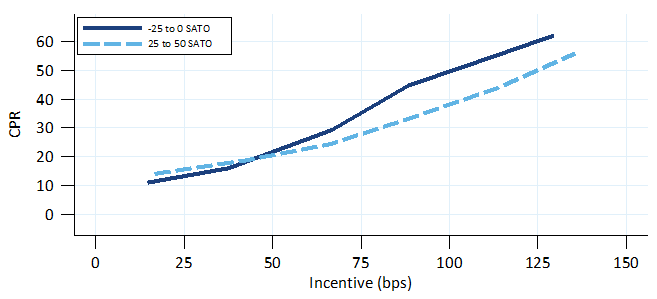
Investors commonly buy low WALA pools, which offer significant prepayment protection before reaching roughly 6 months of seasoning. Buying low WALA pools that also have high SATO can add value through additional call protection after six months of seasoning.
Exhibit 4 shows the aggregate S-curves for lower SATO (−25 to 0 bp) and higher SATO (25 to 50 bp) loans. The S-curve for higher SATO loans has, on average, roughly 25% slower refinance response than the high SATO loans.
Exhibit 4: Higher SATO loans refinance roughly 25% slower
Source: Fannie Mae, Freddie Mac, eMBS, Amherst Pierpont Securities
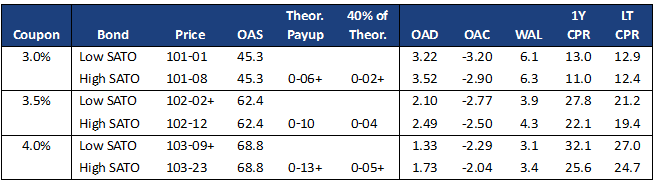
To price this difference three Fannie Mae major pools (3.0%–4.0%) were run through Yield Book. The pools selected had reasonably similar SATO and were all issued in 2019. Selecting the pools is an imperfect exercise—it is not possible to find major pools that have different coupons but have the same SATO and seasoning.
Each pool was run through two scenarios. The first scenario used the production model, and the second scenario tuned the production model with a 25% slower refinance response from months 6 through 24. The assumption is that low SATO provides little benefit before month 6, and that after month 24 the loans have cured and should prepay comparably to the low SATO loans. Both scenarios for each pool were run at the appropriate TBA’s OAS (Exhibit 5).
The difference in price between the two scenarios is the theoretical pay-up for high SATO above a typical low WALA, low SATO pool. This approach minimizes any noise introduced by picking pools with slightly different levels of seasoning, since the same pool is run through both scenarios.
Exhibit 5: High SATO loans can be worth 6+to 13+ ticks above the low WALA pay-up
Source: Yield Book, Amherst Pierpont Securities
This analysis suggests that 18 months of prepayment protection from SATO is worth 6.5/32s on a 3.0% pool and 13.5/32s on a 4.0% pool. Many investors will pay up to 40% of the theoretical value, which implies paying 2.5/32s to 5.5/32s for high SATO in addition to the low WALA pay-up.