Uncategorized
Signs of stress in leveraged loans
admin | October 18, 2019
This material is a Marketing Communication and does not constitute Independent Investment Research.
The price of the average leveraged loan has slowly drifted lower since early May before accelerating recently. With falling loans prices have come the first signs of distress in the most sensitive classes of CLOs. All of this comes as other US credit markets generally show strength. CLOs themselves, however, are a likely source of some of the stress in leveraged loans. It is a fragile cycle.
The average leveraged loan has dropped from a price of $97.53 in early May to $95.50 most recently, with $0.82 coming since the start of September alone (Exhibit 1). It is not the most severe drop in loan pricing even in the last year; prices from last October through January dropped by $4.81. Still, the most sensitive classes of CLOs have widened as loan prices have dropped and recently have moved sharply wider than levels of a year ago. The most liquid ‘BB’ CLO classes tracked by the Palmer Square index now trade at a spread of 750 bp over LIBOR, more than 35 bp wide of their mark in late December. The ‘BB’ debt of smaller and less liquid CLO managers recently has traded at spreads of more than 1,000 bp.
Exhibit 1: Loan prices and CLO spreads have weakened sharpened lately
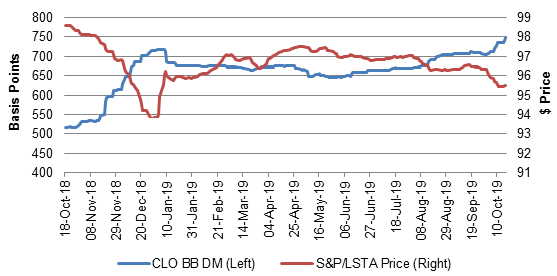
Source: Palmer Square, S&P/LSTA via Bloomberg.
If weaker loan prices and wider CLO spreads reflected broad concerns about credit, then it is not showing up in other markets. ‘BB’ CLO spreads have widened this year while ‘BB’ high yield debt, which typically is less senior to loans with lower historic recoveries after default, have tightened (Exhibit 2). A similar pattern of wider CLO spreads and tighter corporate spreads shows up at other levels of high yield and investment grade corporate debt. It may be something unique about leveraged loan credit, but that seems doubtful.
Exhibit 2: Divergence this year between CLO and corporate credit
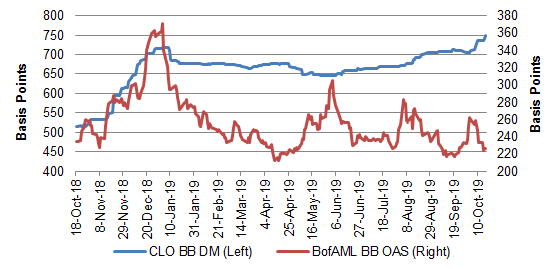
Source: Palmer Square, S&P/LSTA via Bloomberg.
The weakness in leverage loans and CLOs looks driven in large part by the CLO market itself. CLOs in 2019 have bought 72% of all leveraged loans, a record level, according to S&P. Retail investors continue to leave the leveraged loan market. At the same time, the share of leveraged loans rated ‘B+’ or lower has hit a record 65%. The combination of dominant CLO demand and rising ‘B+’ and lower credit has become a volatile combination. And the volatility is created by a pair of details of CLO structure itself: the impact of loan downgrades and the consequences of buying deeply discounted loans.
The downgrade of any CLO loan to ‘CCC’ counts against a limit on ‘CCC’ exposure, and if the deal exceeds that limit, bad things happen to the owner of deal equity. CLO managers often own the equity. In particular, deals often have a 7.5% exposure limit to ‘CCC’ loans. If the deal exceeds that limit by enough, then tests designed to protect senior classes force a diversion of principal and interest away from equity and toward paying down senior debt.
The rapid rise of ‘B+’ and weaker loans has left CLO managers with a thin cushion between a normally functioning deal and a troubled one. A downgrade of a single notch could easily push a deal over its ‘CCC’ limit. In fact, spreads on ‘B+’ and weaker loans have widened lately while spreads on ‘BB-‘ and stronger loans have tightened (Exhibit 3). Some ‘BB’ loans anecdotally have traded as tight as 175 bp over LIBOR, well inside the usual spread of 200 bp that defines a leveraged loan. The disparity between ‘BB’ and ‘B’ loans has all the fingerprints of a dominant CLO bid willing to pay a premium to buy protection against a sudden slide to ‘CCC.’
Exhibit 3: Disparity between ‘BB’ and ‘B’ spreads has the marks of CLO buyers
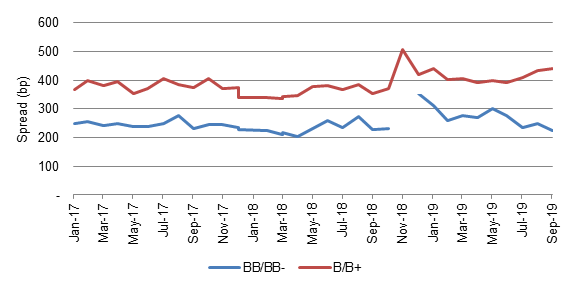
Source: S&P
The rising role of CLOs in leveraged loans also creates sudden breaks in the willingness of investors to buy loans at prices below $80. If a CLO buys a ‘B3’ or better loan above that price, the deal can use the full par amount of the loan in tests that measure the continuing strength of the deal. The deal can continue to use the full par amount of the loan even if the price later sinks below $80. However, if the CLO takes a new ‘B3’ loan on its books below $80, it can only use the market value of the loan to pass those tests. Buying deeply discounted loans not only immediately weakens the ability of the deal to pass its tests, it potentially weakens the deal further if the price continues to drop. Buying loans below $80 becomes a dangerous game for a CLO manager where a failed test leads again to diversion of principal and interest away from equity.
The implication for the leveraged loan market is that the rising role of CLO capital has created an air pocket below $80 where capital suddenly dries up and may not reemerge until prices drop well below the economic value of the loan. It potentially becomes a dangerous cycle where initial signs of any weakness in a ‘B’ credit triggers selling, and breaks in the concentration of capital at different price points allow the price to gap lower. The risk of sudden drops in ‘B’ loan prices add to their risk and widens their spread, and the cycle begins again.
Although demand from CLOs has helped broaden the market for leveraged loans since the 2008 financial crisis, the constraints of CLO structure have likely started to have an unexpected impact on the cost of credit in that market. ‘B’ credits now pay more, and it likely has more to do with the peculiarities of CLO structure than with the borrowers’ willingness and ability to pay.
* * *
The view in rates
The markets view of another Fed cut by the end of this year bounced up a bit from the week before, rising from 82% to 92%. Dialogue from the Fed remained vague as usual, so that offered limited guidance. The curve steepened, and 10-year implied inflation rise slightly. It is hard to be anything other than neutral on rates.
The view in spreads
Except for the leveraged loan and CLO markets, investment grade and high yield credit continue to tighten. Chalk that up to an accommodative Fed and perhaps to the Fed’s latest efforts to smooth liquidity in repo markets. MBS has lagged credit and should continue to trade at soft spreads largely due to heavy volumes of refinanced loans flowing through the market. MBS spreads should stay soft through the balance of the year and start to tighten thereafter.
The view in credit
Slowing global growth will almost certainly catch the most leveraged credits, and spreads in leverage loans reflect some of that concern. Leverage in investment grade corporate credit also has trended up this year. As for the US consumer, low unemployment, high income and high aggregate household wealth leave consumer balance sheets in good shape. The readiness of the Fed, the ECB and other central banks to backstop growth makes broad recession unlikely. The weakest credits should feel a slowing economy, but without recession, the averages should remain good.
This material is intended only for institutional investors and does not carry all of the independence and disclosure standards of retail debt research reports. In the preparation of this material, the author may have consulted or otherwise discussed the matters referenced herein with one or more of SCM’s trading desks, any of which may have accumulated or otherwise taken a position, long or short, in any of the financial instruments discussed in or related to this material. Further, SCM may act as a market maker or principal dealer and may have proprietary interests that differ or conflict with the recipient hereof, in connection with any financial instrument discussed in or related to this material.
This message, including any attachments or links contained herein, is subject to important disclaimers, conditions, and disclosures regarding Electronic Communications, which you can find at https://portfolio-strategy.apsec.com/sancap-disclaimers-and-disclosures.
Important Disclaimers
Copyright © 2026 Santander US Capital Markets LLC and its affiliates (“SCM”). All rights reserved. SCM is a member of FINRA and SIPC. This material is intended for limited distribution to institutions only and is not publicly available. Any unauthorized use or disclosure is prohibited.
In making this material available, SCM (i) is not providing any advice to the recipient, including, without limitation, any advice as to investment, legal, accounting, tax and financial matters, (ii) is not acting as an advisor or fiduciary in respect of the recipient, (iii) is not making any predictions or projections and (iv) intends that any recipient to which SCM has provided this material is an “institutional investor” (as defined under applicable law and regulation, including FINRA Rule 4512 and that this material will not be disseminated, in whole or part, to any third party by the recipient.
The author of this material is an economist, desk strategist or trader. In the preparation of this material, the author may have consulted or otherwise discussed the matters referenced herein with one or more of SCM’s trading desks, any of which may have accumulated or otherwise taken a position, long or short, in any of the financial instruments discussed in or related to this material. Further, SCM or any of its affiliates may act as a market maker or principal dealer and may have proprietary interests that differ or conflict with the recipient hereof, in connection with any financial instrument discussed in or related to this material.
This material (i) has been prepared for information purposes only and does not constitute a solicitation or an offer to buy or sell any securities, related investments or other financial instruments, (ii) is neither research, a “research report” as commonly understood under the securities laws and regulations promulgated thereunder nor the product of a research department, (iii) or parts thereof may have been obtained from various sources, the reliability of which has not been verified and cannot be guaranteed by SCM, (iv) should not be reproduced or disclosed to any other person, without SCM’s prior consent and (v) is not intended for distribution in any jurisdiction in which its distribution would be prohibited.
In connection with this material, SCM (i) makes no representation or warranties as to the appropriateness or reliance for use in any transaction or as to the permissibility or legality of any financial instrument in any jurisdiction, (ii) believes the information in this material to be reliable, has not independently verified such information and makes no representation, express or implied, with regard to the accuracy or completeness of such information, (iii) accepts no responsibility or liability as to any reliance placed, or investment decision made, on the basis of such information by the recipient and (iv) does not undertake, and disclaims any duty to undertake, to update or to revise the information contained in this material.
Unless otherwise stated, the views, opinions, forecasts, valuations, or estimates contained in this material are those solely of the author, as of the date of publication of this material, and are subject to change without notice. The recipient of this material should make an independent evaluation of this information and make such other investigations as the recipient considers necessary (including obtaining independent financial advice), before transacting in any financial market or instrument discussed in or related to this material.
Important disclaimers for clients in the EU and UK
This publication has been prepared by Trading Desk Strategists within the Sales and Trading functions of Santander US Capital Markets LLC (“SanCap”), the US registered broker-dealer of Santander Corporate & Investment Banking. This communication is distributed in the EEA by Banco Santander S.A., a credit institution registered in Spain and authorised and regulated by the Bank of Spain and the CNMV. Any EEA recipient of this communication that would like to affect any transaction in any security or issuer discussed herein should do so with Banco Santander S.A. or any of its affiliates (together “Santander”). This communication has been distributed in the UK by Banco Santander, S.A.’s London branch, authorised by the Bank of Spain and subject to regulatory oversight on certain matters by the Financial Conduct Authority (FCA) and the Prudential Regulation Authority (PRA).
The publication is intended for exclusive use for Professional Clients and Eligible Counterparties as defined by MiFID II and is not intended for use by retail customers or for any persons or entities in any jurisdictions or country where such distribution or use would be contrary to local law or regulation.
This material is not a product of Santander´s Research Team and does not constitute independent investment research. This is a marketing communication and may contain ¨investment recommendations¨ as defined by the Market Abuse Regulation 596/2014 ("MAR"). This publication has not been prepared in accordance with legal requirements designed to promote the independence of research and is not subject to any prohibition on dealing ahead of the dissemination of investment research. The author, date and time of the production of this publication are as indicated herein.
This publication does not constitute investment advice and may not be relied upon to form an investment decision, nor should it be construed as any offer to sell or issue or invitation to purchase, acquire or subscribe for any instruments referred herein. The publication has been prepared in good faith and based on information Santander considers reliable as of the date of publication, but Santander does not guarantee or represent, express or implied, that such information is accurate or complete. All estimates, forecasts and opinions are current as at the date of this publication and are subject to change without notice. Unless otherwise indicated, Santander does not intend to update this publication. The views and commentary in this publication may not be objective or independent of the interests of the Trading and Sales functions of Santander, who may be active participants in the markets, investments or strategies referred to herein and/or may receive compensation from investment banking and non-investment banking services from entities mentioned herein. Santander may trade as principal, make a market or hold positions in instruments (or related derivatives) and/or hold financial interest in entities discussed herein. Santander may provide market commentary or trading strategies to other clients or engage in transactions which may differ from views expressed herein. Santander may have acted upon the contents of this publication prior to you having received it.
This publication is intended for the exclusive use of the recipient and must not be reproduced, redistributed or transmitted, in whole or in part, without Santander’s consent. The recipient agrees to keep confidential at all times information contained herein.


