


Uncategorized
Big US bank 3Q19 earnings re-cap
admin | October 18, 2019
This material is a Marketing Communication and does not constitute Independent Investment Research.
In an odd bit of scheduling, four of the big 6 US banks (JPM, GS, C, WFC) reported 3Q results on the first day of a busy earnings week. Expectations were muted heading into this quarter’s reporting calendar, amid rate pressure, moderate loan demand and uncertainty about consistent trading volumes. The main takeaway from the first week was that investors largely shook off initial negative reactions to some of the banks’ results, and instead focused on the positives in what appeared to be a more resilient performance in the difficult operating environment than originally perceived. Strong FICC trading and investment banking fees largely offset rate concerns. Bottom-line results were bolstered by aggressive share repurchase activity and continued focus on expense reduction. The challenging rate environment remains an ongoing obstacle for bank profitability.
Issuance has been somewhat quiet so far, with BAC providing the only major post-earnings foray into the new issue market – printing $4 billion in 6NC5s (@ +88/5-year) and 11NC10s (@ +113/10-year). Regionals Bank New York Mellon (BK: 5-year @ +57) and PNC Bank (PNC: 10-year bank bub@ +100) added to the weekly total. All four deals seemed to price pretty close to perfection. Although the first week saw thin volume, markets may see some additional issuance on the follow; however, the banks have been front-loading more their funding needs over the past several years, and a few surprise deals printed amidst the September deluge of IG new issue (JPM, WFC).
Money center bank earnings re-caps
Goldman Sachs (GS: A3/BBB+/A): If there was a “loser” among the first banks to report, it was Goldman. GS missed the consensus estimate with EPS of $4.79, led by significant losses in its Investment & Lending segment. GS booked net losses of $267 million in equities, which management attributed to Uber, Avantor and TradeWeb, resulting in $1.68 billion in revenue, or a -17% drop from the prior year. Those losses were mitigated by a +8 increase in fixed income currencies and commodities (FICC) trading revenue to $1.41 billion and +5% increase in equities trading to $1.88 billion. Investment banking was also worse than anticipated, down -15% year-over-year , led by a -22% drop in M&A advisory. Bottom-line: Shares have recovered and are basically trading flat this afternoon after selling off earlier. Goldman’s miss is much more of an equity story, as they are likely to outsized upside in subsequent quarters on surprise gains on I&L investments that are more unique to GS than peers.
Wells Fargo’s (WFC: A2/A-): Also on the downside of this week’s results was WFC’s 3Q19 EPS miss of $0.92 vs the $1.13 consensus estimate. WFC took a $1.6 billion charge related to litigation expenses tied to the scandals at the retail bank. This charge should not come as a major surprise to the market. The bank announced the hire of its new CEO – BNY veteran Charlie Scharf – so it makes perfect sense that the bank would book another hit before their new, clean CEO takes the reins. Ex-CEO Sloan stepped down abruptly in March of this year. He was never going to be the long-term solution at CEO, he was elevated to that role to weather the storm and allow the bank time to work its way out of the proverbial box. Scharf will begin his tenure with WFC still under Fed consent order to curb asset growth. The limit on growth mandated by the Fed was initiated back in early 2018, and the Fed indicated at the start of this year that the order would not be lifted in 2019. WFC’s earnings were otherwise dragged down by the difficult rate environment similar to peers, as the net interest margin (NIM) declined to 2.66% from 2.94% year-over-year, driving a -7.5% decreased in net interest income.
JP Morgan (JPM: A2/A-/AA-): JPM was viewed among the third quarter “winners,” as the bank’s results showed greater stability amidst the difficult rate environment and continued to demonstrate the strength of JPM’s investment banking and trading franchises. 3Q19 EPS of $2.68 came in well ahead of consensus estimate ($2.46), as total revenue grew an impressive +8% year-over-year. Results were led by a +25% increase in FICC trading revenue to $3.56 billion, which management attributed to good flows in rates and commodities within its fixed income trading business. Investment Banking revenue was also stronger than peers, with a +8% year-over-year increase led by Debt Underwriting activity. Consumer and commercial banking also fared better than peers, with net interest income ($14.2 billion) up modestly year-over-year.
Citigroup (C: A3/BBB+/A): 3Q19 earnings also seemed to fall on the positive side of today’s results with EPS of $1.97 edging out estimates, with a modest top-line gain of +1% in total revenue. Consumer Banking revenue was flat at roughly $8.7 bn, as was FICC trading revenue at about $3.2 bn, offsetting a modest -4% drop in Equities Trading YoY. The NIM fell to 2.56% from 2.70% YoY, which seemed to fall within the range of likely expectations. Again, Citi was among the more aggressive in reducing share count, and helping offset the more challenging operating environment.
Bank of America’s (BAC: A2/A-/A+): Markets reacted positively to BAC’s 3Q19 results. Adjusted EPS of $0.75 beat the consensus estimate (nominal $0.56 v $0.66 included one-time impairment charge). Favorable operating results for the quarter looks to be a bit of a one-trick pony, but a pretty good trick as debt underwriting success drove a big beat in IB fees at $1.5 billion, up +27% year-over-year. New management at the investment bank appears to have stoked business amidst the strong new issue calendar. Fixed income trading was roughly flat/down slightly year-over-year (ex-DVA), while equities revenue was up about +13%. Traditional banking is facing the same challenges as the broader peer group, with moderate loan growth, lower margins, and an emphasis on cost controls. Efforts to get costs down are helping weather the environment with firm-wide efficiency ratio (all costs/revenue) down to 57% and within consumer banking improving 63 bp year-over-year to 45%. Bottom-line: investment banking result was probably enough to land BAC alongside JPM and Citi among this quarters “winners”; although most of the sector, including the money centers and large regionals that have reported so far, seem to be navigating the challenges effectively.
Morgan Stanley (MS: A3/BBB+/A): MS was the last of the big 6 US money center banks to report 3Q19 earnings, recording adjusted EPS of $1.21 vs the $1.10 consensus estimate ($1.21 nominal; adjustment included the calculation of preferred dividends). Shares are up ~4% in premarket trading. The big line item in their results was the surprise +21% increase in Fixed Income trading revenue ($1.12 billion), which ranked second only to JPM (+25%) for 3Q year-over-year performance (GS +8%, BAC +0%, C +0%) and the single largest beat on estimates. Equity markets revenue was down -1.4%, in-line with flatter results at JPM and Citi. Despite a +5% year-over-year gain by closest peer GS, Morgan Stanley retained the top overall revenue generator in the peer group at $1.99 billion in quarterly Equity trading revenue. Management’s decision over the past several years to shift toward a more retail model than they had previously operated under has paid off and driven substantial gains over GS over that time period (though likely sacrificing the kind of big, surprise one-time earnings upside that GS still maintains). Investment banking fees increased +5% year-over-year as a +15% gain in debt underwriting and +8% gain in M&A helped offset the -9% decline in equity underwriting.
Big bank credit curves and relative value
Curves are very efficient at the moment; there are better opportunities along the curve in C 3.875 ’25 (subs), C 3.7 ’26 (seniors), BAC 3.95 ’25 (subs) and BAC 3.705 ’28 (seniors).
Exhibit 1. BAC and Citi senior and subordinated curves
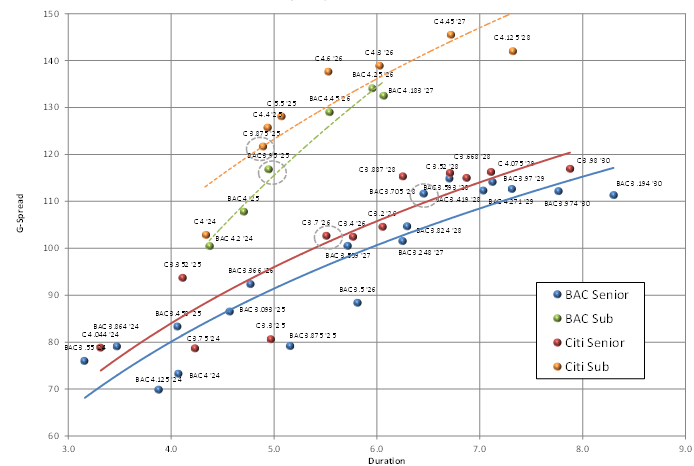
Source: Amherst Pierpont, Bloomberg/TRACE Indications
Overall investors should focus on the additional spread available in GS longer-dated intermediates; better opportunities are available along the curve in MS 4.35 ’26 (subs), GS 3.5 ’25 (seniors), and MS 3.875 ’26 (seniors) (Exhibit 2).
Exhibit 2. GS and MS senior and subordinated curves
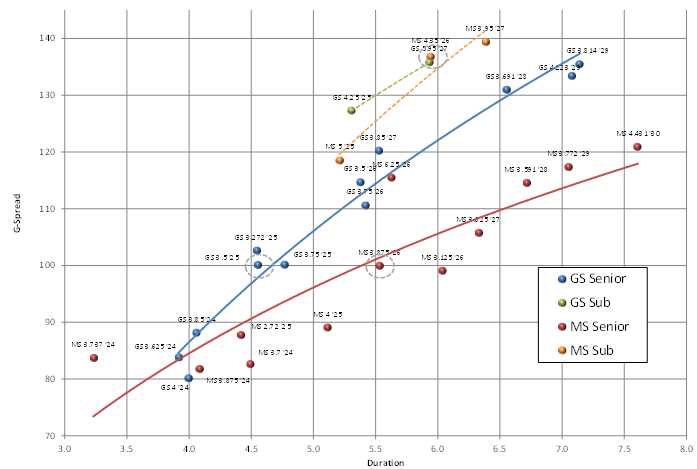
Source: Amherst Pierpont, Bloomberg/TRACE Indications
Obviously, among the higher quality credits, the curves are even more efficient (Exhibit 3); however, there is some opportunity for more active traders to be targeting the following issues: JPM 3.125 ’25 (seniors), WFC 3 ’26 (seniors), and in particular the WFC 4.1 ’26 (subs).
Exhibit 3. JPM and WFC senior and subordinated curves
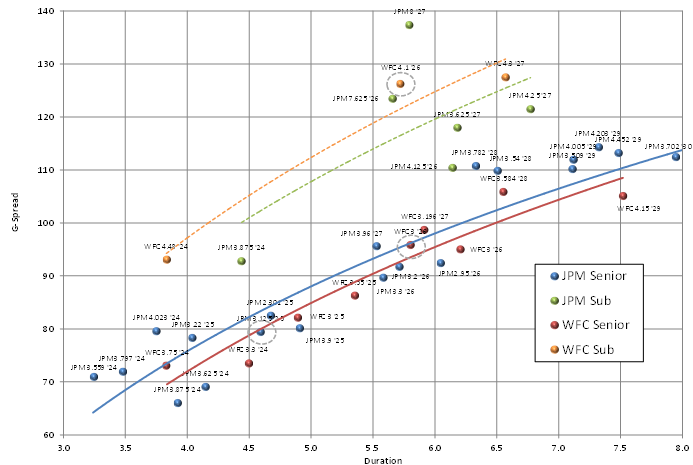
Source: Amherst Pierpont, Bloomberg/TRACE Indications