Uncategorized
Conventional speeds jump, Ginnie Mae may remain fast
admin | October 11, 2019
This material is a Marketing Communication and does not constitute Independent Investment Research.
Interest rates since mid-September have dropped back to levels reached in August and have kept investors worried about elevated prepayment speeds. Conventional speeds in September increased overall by more than 10%, primarily driven by pickups in newer vintage cohorts and especially by 2018 production. Ginnie Mae speeds lagged but look likely to rise in the months ahead. Combined with changes to bank liquidity regulations approved by the Fed on October 10, faster speeds could hurt Ginnie Mae performance.
Overall Fannie Mae 30-year speeds increased 11.9% to 19.3 CPR from 17.4 CPR and Freddie Mac 30-year speeds increased 14.3% to 20.1 CPR from 17.8 CPR, both somewhat faster than expectations. Although driving rates were lower in September, seasonal turnover begins to slow and there were two fewer business days compared to August. Both factors suppressed some of the rate-driven pickup in prepayments. Loans are most refinanceable between six and 24 months of seasoning, and the surprisingly fast 2018 vintage is almost entirely in this seasoning band.
Exhibit 1: Conventional speeds jump in September
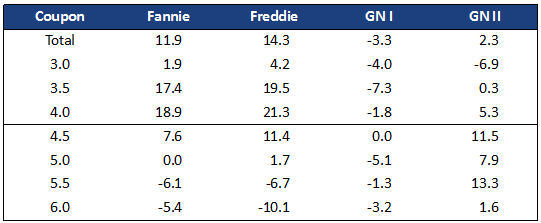
Note: % change in 30-year prepayment speeds from August 2019 to September 2019. Source: Fannie Mae, Freddie Mac, Ginnie Mae, eMBS, Amherst Pierpont Securities
Ginnie Mae speeds were more muted, partially due to better call protection at low WALAs. However the MBA Government Refinance Index remains elevated and the gap over the conventional refinance index has widened. This suggests that Ginnie Mae speeds will remain elevated and that 2019 vintage Ginnie Mae speeds are poised to increase as the loans season past six months.
Ginnie Mae II prepayment speeds increased only 2.3% to 23.0 CPR from 22.5 CPR. Many 2019 pools are still not seasoned enough to refinance, and many of the seasoned cohorts are already prepaying extremely quickly. The government refinance index picked up earlier than the conventional refinance index, peaked higher, and has not fallen as much as the conventional index over the last month.
Looking ahead
Prepayment speeds should pick up by about 10% in October primarily due to 2.5 additional business days. Interest rates increase roughly 8 bp on a 30-day lag but fall roughly 7 bp on a 45-day lag, which should boost speeds on more seasoned cohorts. Speeds should slow by about 10% to 15% in November, which is a very short month due to the holidays, although lower lagged interest rates will support speeds on newer vintages. At current interest rates roughly 50% of agency mortgages are refinanceable (at least 75 bp in-the-money).
The 2018 conventional MBS vintage surges
Conventional 30 year pools issued in 2018 prepaid much faster in September. The S-curve is steepest for loans 6 to 24 months seasoned (Exhibit 2), and 99% of the 2018 vintage is within that seasoning band.
Exhibit 2: The S-curve peaks between 6 to 12 months seasoning
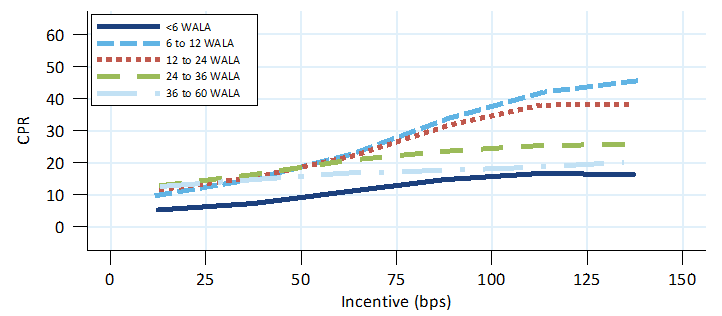
Note: 30-year fixed rate loans, original loan size >$200,000, original LTV≤80; speeds from January 2018 through September 2019. Source: Fannie Mae, Freddie Mac, eMBS, Amherst Pierpont Securities
However, 2018 speeds were even faster than the S-curves suggest. At the steepest part of the S-curve a 20 basis point rally (mortgage rates fell roughly 20 bp in September on a 30-day lag) suggests speeds should increase roughly 4.0 CPR. There were two fewer business days, which should have lowered speeds roughly 1.5 CPR, which brings the expected speed increase to about 2.5 CPR.
The 3.5%s and 4.0%s of 2018 both blew past this estimate, increasing 5.8 CPR and 7.1 CPR respectively. Interest rates have reached recent lows and this is the first refinance opportunity many of these borrowers have faced. So it is likely that the S-curve is steepened due to a media effect and increased solicitation efforts.
The 2017 vintage was less responsive than the 2018 vintage
The 2017 vintage 3.5%s and 4.0%s are prepaying slower than the respective 2018 vintage cohorts—the pickup from August to September was smaller and the absolute levels are lower. This is primarily due to seasoning—the 2017 vintage is almost entirely over 20 months seasoned, while the 2018 vintage is mostly less than 2 years seasoned.
There are reasons other than seasoning that could explain slower prepayments, but do not hold up to scrutiny. One possibility is that the 2017 vintage could be slower from burnout. A loan is “burned out” when the borrower has passed up opportunities to refinance. Those loans prove to be less likely to refinance the next time interest rates fall. However the 2017 vintage never had an opportunity to refinance prior to 2019. In fact the 2017 vintage has averaged only 6.8 CPR lifetime through March 2019, which is not much above baseline turnover levels.
The late 2018 vintage pools also have a much higher gross WAC than previous vintages, which also contributes to faster speeds. However, comparing the two vintages using S-curves controls for the gross WAC differences and shows that the 2018 vintage had a much steeper S-curve (Exhibit 3).
Exhibit 3: The 2018 vintage S-curve was much steeper than the 2017 S-curve
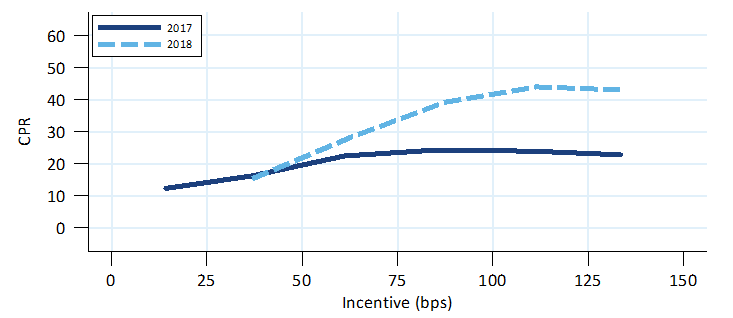
Note: 30-year fixed rate loans, original loan size >$200,000, original LTV≤80, original LTV≤80; speeds in September 2019 only. Source: Fannie Mae, Freddie Mac, eMBS, Amherst Pierpont Securities
Another reason the 2017 vintage might be slower is spread at origination (SATO), which measures how much higher or lower a loan’s note rate is compared to other loans originated at the same time. A higher SATO indicates a loan was charged higher fees by the GSEs and/or lender, and is likely a worse credit. Higher SATO loans will prepay slower initially (if the borrower’s credit cures then speeds could pickup). A 2017 loan will have a higher SATO than a 2018 loan with the same note rate since rates were lower in 2017. However, excluding loans with SATO>25 bp from the S-curves shows that the speed difference remains (Exhibit 4).
Exhibit 4: The 2018 vintage S-curve was steeper after removing high SATO loans
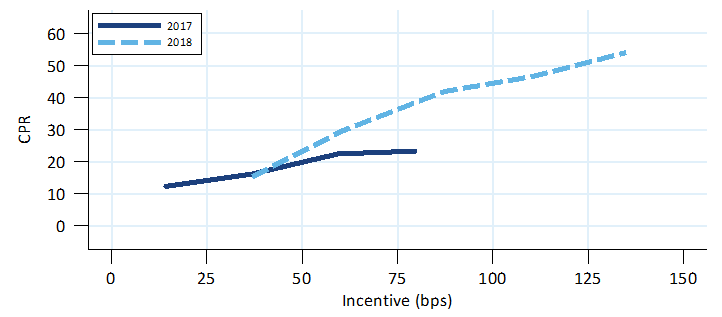
Note: 30-year fixed rate loans, original loan size >$200,000, original LTV≤80, SATO<25 basis points; speeds in September 2019 only. Source: Fannie Mae, Freddie Mac, eMBS, Amherst Pierpont Securities
This leaves seasoning as the most likely reason that the 2018 vintage prepaid faster than the 2017 vintage. Loans that were originated more recently are easier to refinance—documentation is more readily available and items like appraisals might still be usable. These borrowers are more likely to be aware of mortgage rates and more likely to get a call from their loan officer. Once a loan is a couple of years of seasoned it is less refinanceable even if it hasn’t yet had a refinance opportunity.
Investors should look at speeds from loans between 6 and 24 months seasoning for guidance regarding peak prepayment speeds. Prepayments can increase to peak levels very soon after a loan surpasses 6 months seasoning, but speeds slow quickly after 2 years of seasoning. The S-curve will flatten even if a loan has not had the opportunity to refinance, suggesting that a portion of the prepayment response is “lost forever” if a loan survives past 24 months seasoning without experiencing low interest rates.
This material is intended only for institutional investors and does not carry all of the independence and disclosure standards of retail debt research reports. In the preparation of this material, the author may have consulted or otherwise discussed the matters referenced herein with one or more of SCM’s trading desks, any of which may have accumulated or otherwise taken a position, long or short, in any of the financial instruments discussed in or related to this material. Further, SCM may act as a market maker or principal dealer and may have proprietary interests that differ or conflict with the recipient hereof, in connection with any financial instrument discussed in or related to this material.
This message, including any attachments or links contained herein, is subject to important disclaimers, conditions, and disclosures regarding Electronic Communications, which you can find at https://portfolio-strategy.apsec.com/sancap-disclaimers-and-disclosures.
Important Disclaimers
Copyright © 2026 Santander US Capital Markets LLC and its affiliates (“SCM”). All rights reserved. SCM is a member of FINRA and SIPC. This material is intended for limited distribution to institutions only and is not publicly available. Any unauthorized use or disclosure is prohibited.
In making this material available, SCM (i) is not providing any advice to the recipient, including, without limitation, any advice as to investment, legal, accounting, tax and financial matters, (ii) is not acting as an advisor or fiduciary in respect of the recipient, (iii) is not making any predictions or projections and (iv) intends that any recipient to which SCM has provided this material is an “institutional investor” (as defined under applicable law and regulation, including FINRA Rule 4512 and that this material will not be disseminated, in whole or part, to any third party by the recipient.
The author of this material is an economist, desk strategist or trader. In the preparation of this material, the author may have consulted or otherwise discussed the matters referenced herein with one or more of SCM’s trading desks, any of which may have accumulated or otherwise taken a position, long or short, in any of the financial instruments discussed in or related to this material. Further, SCM or any of its affiliates may act as a market maker or principal dealer and may have proprietary interests that differ or conflict with the recipient hereof, in connection with any financial instrument discussed in or related to this material.
This material (i) has been prepared for information purposes only and does not constitute a solicitation or an offer to buy or sell any securities, related investments or other financial instruments, (ii) is neither research, a “research report” as commonly understood under the securities laws and regulations promulgated thereunder nor the product of a research department, (iii) or parts thereof may have been obtained from various sources, the reliability of which has not been verified and cannot be guaranteed by SCM, (iv) should not be reproduced or disclosed to any other person, without SCM’s prior consent and (v) is not intended for distribution in any jurisdiction in which its distribution would be prohibited.
In connection with this material, SCM (i) makes no representation or warranties as to the appropriateness or reliance for use in any transaction or as to the permissibility or legality of any financial instrument in any jurisdiction, (ii) believes the information in this material to be reliable, has not independently verified such information and makes no representation, express or implied, with regard to the accuracy or completeness of such information, (iii) accepts no responsibility or liability as to any reliance placed, or investment decision made, on the basis of such information by the recipient and (iv) does not undertake, and disclaims any duty to undertake, to update or to revise the information contained in this material.
Unless otherwise stated, the views, opinions, forecasts, valuations, or estimates contained in this material are those solely of the author, as of the date of publication of this material, and are subject to change without notice. The recipient of this material should make an independent evaluation of this information and make such other investigations as the recipient considers necessary (including obtaining independent financial advice), before transacting in any financial market or instrument discussed in or related to this material.
Important disclaimers for clients in the EU and UK
This publication has been prepared by Trading Desk Strategists within the Sales and Trading functions of Santander US Capital Markets LLC (“SanCap”), the US registered broker-dealer of Santander Corporate & Investment Banking. This communication is distributed in the EEA by Banco Santander S.A., a credit institution registered in Spain and authorised and regulated by the Bank of Spain and the CNMV. Any EEA recipient of this communication that would like to affect any transaction in any security or issuer discussed herein should do so with Banco Santander S.A. or any of its affiliates (together “Santander”). This communication has been distributed in the UK by Banco Santander, S.A.’s London branch, authorised by the Bank of Spain and subject to regulatory oversight on certain matters by the Financial Conduct Authority (FCA) and the Prudential Regulation Authority (PRA).
The publication is intended for exclusive use for Professional Clients and Eligible Counterparties as defined by MiFID II and is not intended for use by retail customers or for any persons or entities in any jurisdictions or country where such distribution or use would be contrary to local law or regulation.
This material is not a product of Santander´s Research Team and does not constitute independent investment research. This is a marketing communication and may contain ¨investment recommendations¨ as defined by the Market Abuse Regulation 596/2014 ("MAR"). This publication has not been prepared in accordance with legal requirements designed to promote the independence of research and is not subject to any prohibition on dealing ahead of the dissemination of investment research. The author, date and time of the production of this publication are as indicated herein.
This publication does not constitute investment advice and may not be relied upon to form an investment decision, nor should it be construed as any offer to sell or issue or invitation to purchase, acquire or subscribe for any instruments referred herein. The publication has been prepared in good faith and based on information Santander considers reliable as of the date of publication, but Santander does not guarantee or represent, express or implied, that such information is accurate or complete. All estimates, forecasts and opinions are current as at the date of this publication and are subject to change without notice. Unless otherwise indicated, Santander does not intend to update this publication. The views and commentary in this publication may not be objective or independent of the interests of the Trading and Sales functions of Santander, who may be active participants in the markets, investments or strategies referred to herein and/or may receive compensation from investment banking and non-investment banking services from entities mentioned herein. Santander may trade as principal, make a market or hold positions in instruments (or related derivatives) and/or hold financial interest in entities discussed herein. Santander may provide market commentary or trading strategies to other clients or engage in transactions which may differ from views expressed herein. Santander may have acted upon the contents of this publication prior to you having received it.
This publication is intended for the exclusive use of the recipient and must not be reproduced, redistributed or transmitted, in whole or in part, without Santander’s consent. The recipient agrees to keep confidential at all times information contained herein.


