Uncategorized
AT&T’s accelerated asset sales are constructive for debt
admin | October 11, 2019
This material is a Marketing Communication and does not constitute Independent Investment Research.
AT&T exceeds asset monetization target
Despite having already surpassed its net $6 billion to $8 billion asset monetization target this year, T announced that it has agreed to sell its Puerto Rican and U.S. Virgin Islands businesses to Liberty Latin America Ltd. for $1.95 billion in cash. The transaction includes network assets (which includes spectrum) as well as real estate/leases, customers (including 1.1 million of wireless subscribers) and contracts. The deal is expected to close within the next 6 to 9 months. Prior to the announcement, T had already achieved roughly $10 billion year to date from monetization/working capital initiatives. This week’s sale announcement puts monetizations – both announced and completed – at over $11 billion for the year. That said, T has noted that they are more than confident of hitting their net leverage target of 2.5x by year end, which would be down from the 2.7x at the end of 2Q19. Since the close of the Time Warner acquisition on 6/15/18, T has reduced net debt by $18 billion. With asset sales exceeding management’s target and the company comfortably within their target leverage range by year end, management will start resuming share repurchase activity in 4Q. Share repurchases are expected to be executed on an opportunistic basis, as debt reduction still remains a priority.
The largest catalyst for spreads continues to be management’s ability to execute on asset sales, as they were imperative in helping T reach its approximate $20 billion of debt reduction for the year. Having exceeded its monetization target, management demonstrated its commitment to both rapid debt reduction and the leverage target. Notably it will take T less time to hit their short- term leverage target post the Time Warner deal than it did to actually close the deal.
Elliot Management takes a stake – a positive for bondholders?
Roughly a month ago, Elliot Management Corporation disclosed that it had taken a $3.2 billion stake in T. In a letter addressed to T management, the hedge fund questioned some of management’s acquisitions, including DirecTV, and challenged them to rethink its strategic rationale behind holding on to certain assets that they deem non-core. Elliot Management’s view is that bigger is not always necessarily better, thereby making T an “outlier” in the communications sector as it continues to make large acquisitions.
Elliot Management’s call for T to shed some assets, particularly DirecTV, would be a positive for T bondholders as the asset is so large that a sale would require further significant debt reduction. This would accelerate debt reduction plans, help the company achieve its longer term leverage target of 2.0x, and enable T to shed an underperforming asset. DirecTV has been witnessing subscriber declines given the rise of streaming services such as Netflix, which has prompted the growing “cord cutting” movement. Elliot Management noted that T purchased DirecTV at the height of satellite. While T witnessed some subscriber growth at the unit post close (from July 2015 through the end of 2016), for the last 9 consecutive quarters, DirecTV has posted subscriber losses. DirecTV ended 2Q19 with 17.9 million U.S. subscribers, its lowest level in over 5 years.
Exhibit 1. DirecTV U.S. video subscribers – quarterly (subscribers in millions)
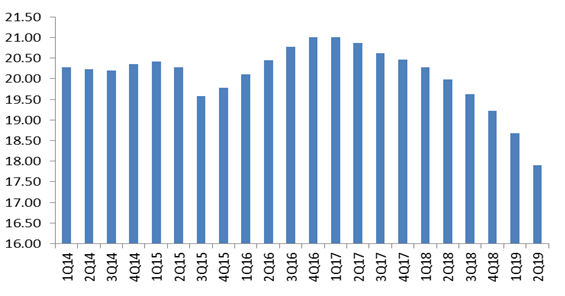
Source: Company Reports; Amherst Pierpont Securities
Relative value
The outlook for T credit remains positive as the short-term leverage target should be hit by year end, and further debt reduction is expected as the company moves towards its 2.0x long term target. June projections were that the T curve could flatten relative to Verizon Communications Inc. (VZ), which made the 15- to 25-year part of the curve most attractive relative to VZ. Taking that a step further, T’s 20-year on-the-run versus off-the-run paper, and how steep that curve is relative to similar paper in VZ’s capital structure. T’s curve between its 4.85% 2039 bonds versus its 6.0% 2040 is currently 35 bp (g-spread). While the higher coupon accounts for some of the steepness, the pick up is attractive to move out the curve 15 months. Comparatively, the curve between VZ 4.812% 2039 bonds versus 4.75% 2041 bonds provides for less than 10 bp (g-spread) pickup for an approximate 32-month extension. T could look to pursue a large waterfall tender for higher coupon debt, particularly if they were to pursue a sale/spin of DirecTV. Even if a sale of DirecTV were not to materialize, T could take advantage of the attractive rate environment and pursue a debt financed tender for the high coupon debt.
Exhibit 2. T Versus VZ – 20-year curve
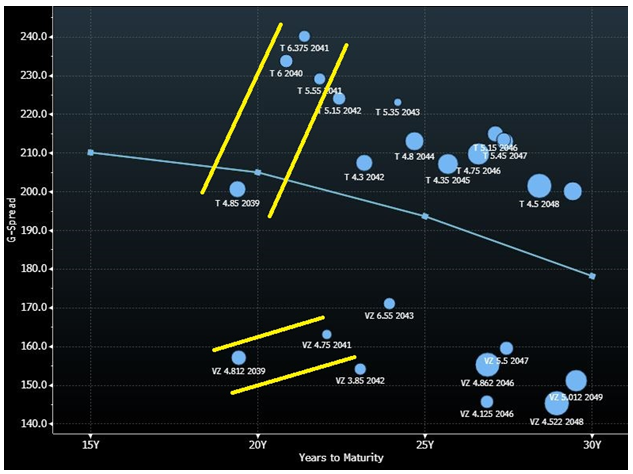
Source: Bloomberg; Amherst Pierpont Securities
This material is intended only for institutional investors and does not carry all of the independence and disclosure standards of retail debt research reports. In the preparation of this material, the author may have consulted or otherwise discussed the matters referenced herein with one or more of SCM’s trading desks, any of which may have accumulated or otherwise taken a position, long or short, in any of the financial instruments discussed in or related to this material. Further, SCM may act as a market maker or principal dealer and may have proprietary interests that differ or conflict with the recipient hereof, in connection with any financial instrument discussed in or related to this material.
This message, including any attachments or links contained herein, is subject to important disclaimers, conditions, and disclosures regarding Electronic Communications, which you can find at https://portfolio-strategy.apsec.com/sancap-disclaimers-and-disclosures.
Important Disclaimers
Copyright © 2026 Santander US Capital Markets LLC and its affiliates (“SCM”). All rights reserved. SCM is a member of FINRA and SIPC. This material is intended for limited distribution to institutions only and is not publicly available. Any unauthorized use or disclosure is prohibited.
In making this material available, SCM (i) is not providing any advice to the recipient, including, without limitation, any advice as to investment, legal, accounting, tax and financial matters, (ii) is not acting as an advisor or fiduciary in respect of the recipient, (iii) is not making any predictions or projections and (iv) intends that any recipient to which SCM has provided this material is an “institutional investor” (as defined under applicable law and regulation, including FINRA Rule 4512 and that this material will not be disseminated, in whole or part, to any third party by the recipient.
The author of this material is an economist, desk strategist or trader. In the preparation of this material, the author may have consulted or otherwise discussed the matters referenced herein with one or more of SCM’s trading desks, any of which may have accumulated or otherwise taken a position, long or short, in any of the financial instruments discussed in or related to this material. Further, SCM or any of its affiliates may act as a market maker or principal dealer and may have proprietary interests that differ or conflict with the recipient hereof, in connection with any financial instrument discussed in or related to this material.
This material (i) has been prepared for information purposes only and does not constitute a solicitation or an offer to buy or sell any securities, related investments or other financial instruments, (ii) is neither research, a “research report” as commonly understood under the securities laws and regulations promulgated thereunder nor the product of a research department, (iii) or parts thereof may have been obtained from various sources, the reliability of which has not been verified and cannot be guaranteed by SCM, (iv) should not be reproduced or disclosed to any other person, without SCM’s prior consent and (v) is not intended for distribution in any jurisdiction in which its distribution would be prohibited.
In connection with this material, SCM (i) makes no representation or warranties as to the appropriateness or reliance for use in any transaction or as to the permissibility or legality of any financial instrument in any jurisdiction, (ii) believes the information in this material to be reliable, has not independently verified such information and makes no representation, express or implied, with regard to the accuracy or completeness of such information, (iii) accepts no responsibility or liability as to any reliance placed, or investment decision made, on the basis of such information by the recipient and (iv) does not undertake, and disclaims any duty to undertake, to update or to revise the information contained in this material.
Unless otherwise stated, the views, opinions, forecasts, valuations, or estimates contained in this material are those solely of the author, as of the date of publication of this material, and are subject to change without notice. The recipient of this material should make an independent evaluation of this information and make such other investigations as the recipient considers necessary (including obtaining independent financial advice), before transacting in any financial market or instrument discussed in or related to this material.
Important disclaimers for clients in the EU and UK
This publication has been prepared by Trading Desk Strategists within the Sales and Trading functions of Santander US Capital Markets LLC (“SanCap”), the US registered broker-dealer of Santander Corporate & Investment Banking. This communication is distributed in the EEA by Banco Santander S.A., a credit institution registered in Spain and authorised and regulated by the Bank of Spain and the CNMV. Any EEA recipient of this communication that would like to affect any transaction in any security or issuer discussed herein should do so with Banco Santander S.A. or any of its affiliates (together “Santander”). This communication has been distributed in the UK by Banco Santander, S.A.’s London branch, authorised by the Bank of Spain and subject to regulatory oversight on certain matters by the Financial Conduct Authority (FCA) and the Prudential Regulation Authority (PRA).
The publication is intended for exclusive use for Professional Clients and Eligible Counterparties as defined by MiFID II and is not intended for use by retail customers or for any persons or entities in any jurisdictions or country where such distribution or use would be contrary to local law or regulation.
This material is not a product of Santander´s Research Team and does not constitute independent investment research. This is a marketing communication and may contain ¨investment recommendations¨ as defined by the Market Abuse Regulation 596/2014 ("MAR"). This publication has not been prepared in accordance with legal requirements designed to promote the independence of research and is not subject to any prohibition on dealing ahead of the dissemination of investment research. The author, date and time of the production of this publication are as indicated herein.
This publication does not constitute investment advice and may not be relied upon to form an investment decision, nor should it be construed as any offer to sell or issue or invitation to purchase, acquire or subscribe for any instruments referred herein. The publication has been prepared in good faith and based on information Santander considers reliable as of the date of publication, but Santander does not guarantee or represent, express or implied, that such information is accurate or complete. All estimates, forecasts and opinions are current as at the date of this publication and are subject to change without notice. Unless otherwise indicated, Santander does not intend to update this publication. The views and commentary in this publication may not be objective or independent of the interests of the Trading and Sales functions of Santander, who may be active participants in the markets, investments or strategies referred to herein and/or may receive compensation from investment banking and non-investment banking services from entities mentioned herein. Santander may trade as principal, make a market or hold positions in instruments (or related derivatives) and/or hold financial interest in entities discussed herein. Santander may provide market commentary or trading strategies to other clients or engage in transactions which may differ from views expressed herein. Santander may have acted upon the contents of this publication prior to you having received it.
This publication is intended for the exclusive use of the recipient and must not be reproduced, redistributed or transmitted, in whole or in part, without Santander’s consent. The recipient agrees to keep confidential at all times information contained herein.


