


Uncategorized
All hands on deck
admin | October 11, 2019
This material is a Marketing Communication and does not constitute Independent Investment Research.
A surprising degree of debate continues among economists and investors over whether slack remains in the labor market despite an unemployment rate now at a 50-year low. Looking at various measures of labor force participation confirms that the labor market is extremely tight, just as the headline unemployment rate suggests.
Labor force participation as an indicator of labor market slack
There has been a lively debate throughout this expansion over the margin of slack in the labor market. In the early part of this decade, it was widely understood that there was ample slack, but disagreement over just how much. As the economy improved and the labor market strengthened, the unemployment rate fell to more normal levels and the debate became more meaningful. In recent years, there have been ample anecdotal reports by businesses that the labor market is downright tight, as firms have had increasing difficulty finding qualified workers, so that the tally of unfilled job openings reached all-time highs. Even so, a minority of Fed officials and economists continue to argue that there are significant reservoirs of slack in the labor market.
For much of this expansion, the labor force participation rate has been depressed, suggesting that there was a pool of potential workers sitting on the sidelines, i.e. not actively looking for work and thus not officially categorized as unemployed, but available to take a job. Indeed, when the unemployment rate reached 5% in late 2015 and 2016, a level that many economists guessed was broadly consistent with full employment, there was still a consensus that slack remained in the form of these sidelined workers.
More recently, anecdotal and survey data unambiguously suggest that the labor market is tight. However, it is difficult to compare across business cycles to gain better context because of secular forces affecting the work force.
Demographics
Specifically, the U.S. population is aging. The giant cohort of Baby Boomers has been moving into retirement age in increasing numbers in recent years and life expectancy has extended noticeably. These two forces mean that retirees are an increasing proportion of the total adult population. This matters for any discussion of the labor force participation rate because the Labor Department defines the working-age population as ages 16 and over. As a result, the growing numbers of retirees has been and will continue to drive down the aggregate labor force participation rate.
There are two ways to try to filter the secular impact of demographics out of the data. First, take the Labor Department data on working-age population and labor force participation, which is broken down into several age brackets, and create a hypothetical aggregate labor force participation series assuming that the age distribution of the working-age population has remained constant over time. Apply actual labor force participation rates over time for the various age brackets to the population distribution that existed at some fixed point.
Exhibit 1: Labor Force Participation Rates
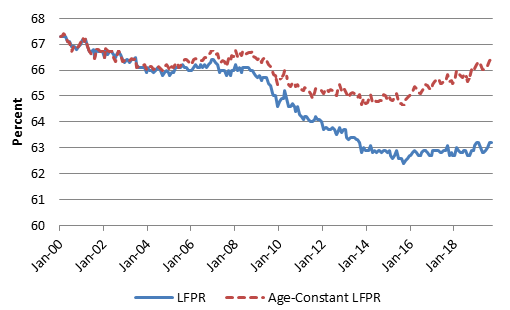
Note: Age-Constant LFPR assumes the age distribution of the working-age population as of January 2000. Source: BLS, AP Sec calculations.
The typically reported labor force participation rate (LFPR) suggests a massive army of available workers sitting on the sidelines (Exhibit 1). The LFPR plunged from around 66% just before the Financial Crisis to just under 63% by 2013 and has been largely flat since then. However, the hypothetical age-constant LFPR series shows that, adjusted for the shift in the age distribution of the working-age population, the LFPR is essentially back to pre-recession levels. In fact, the September 2019 reading of 66.5% is almost exactly in line with the 2006-2007 levels and is only about half a percentage point below the levels reached in the late 1990s, the last time that the unemployment rate was below 4%.
A second way to control for the aging population is to focus only on prime-age cohorts. The LFPR for the 25-54 age bracket eliminates the issue of retiring Baby Boomers (Exhibit 2). This measure has also recovered almost all of the ground lost during and after the 2008-09 recession.
Exhibit 2: Labor Force Participation Rate Ages 25-54
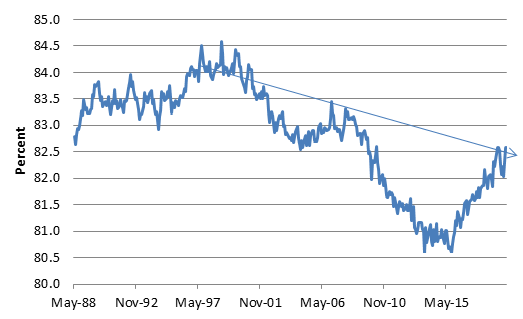
Source: BLS.
This measure also points to the possibility of additional structural headwinds to labor force participation. The trend line drawn in the exhibit shows that, in addition to the cyclical swings, there appears to be a secular downtrend in labor force participation over the past 20 years. Economists have explored various explanations, including liberalized eligibility for federal disability payments, opioid addiction, and the permanent destruction of low- and middle-skilled jobs in the U.S. due to technological disruption and globalization.
Thus, there remains some debate about whether it is realistic to expect the prime-age participation rate to return all the way to the 2006-07 peak of over 83%, much less the 84% readings seen in the late 1990s. In any case, the prime-age LFPR suggests that at least most of the slack has been absorbed.
Discouraged workers
The BLS household survey provides another way of trying to gauge the size of the pool of available workers. The questionnaire starts with 1) Do you have a job? If the answer is no, then question 2) is: Did you actively search for work last month? Respondents who answer “yes” to question 1 are classified as employed. Those who answer “no” to question 1 and “yes” to question 2 are unemployed. The sum of employed and unemployed respondents makes up the labor force. If the respondent answers “no” to both, the BLS probes further. Most respondents who are not working and not looking to work are happily on the sidelines, perhaps retired, a stay-at-home parent, or a full-time student. However, there is a classification of individuals who say that they would in theory like to have a job but did not actively look for work in the past month (someone might interrupt or delay a job search for any number of reasons), and within that category, there is a narrower group of respondents who specifically stated that the reason they did not look for work is because they felt that the prospect of finding a job was poor, a definition of what economists and policymakers have historically referred to as “discouraged workers.”
Exhibit 3: Pool of Respondents Not in the Labor Force but Who Want to Work
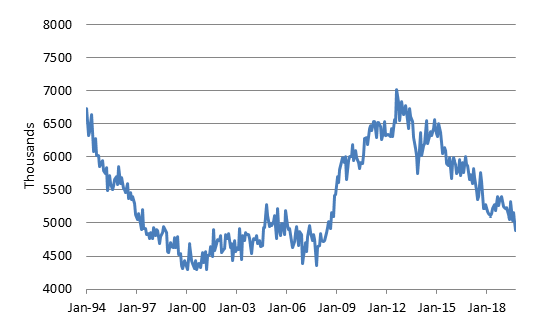
Source: BLS.
The broad group of those who were not looking but in theory want to work fell in September to below 5 million for the first time since 2008 (Exhibit 3). While it looks like the pool was smaller in the late 2000s, it should be noted that the size of the working-age population has increased substantially since then. As a percentage of the total working-age population, this pool represented 1.9% in September, equaling the lowest reading in the 2000s.
Exhibit 4: Discouraged Workers
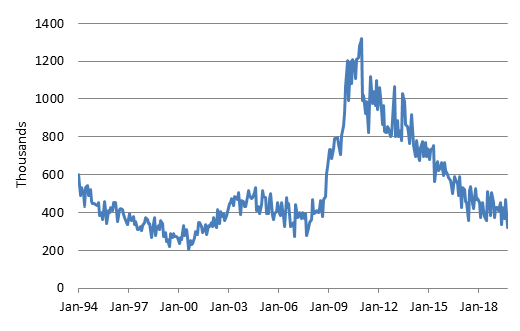
Source: BLS.
Similarly, the narrower classification of discouraged workers, those who specifically did not look for work over the last month because they felt that the market was too soft, dropped to 321,000, the lowest reading since 2007 and well below the prevailing trend in the pre-Crisis years (Exhibit 4).
Combining those officially classified as unemployed with the pool of available workers suggests a broader unemployment rate that includes everyone as unemployed who was not working but said that they wanted to work, whether they were actively looking for a job in the past month or not. This gauge fell in September to 6.3%, the lowest reading in the history of the series by a significant margin (Exhibit 5). Even in the super-tight labor market of the late 1990s, this measure bottomed out at 6.8%.
Exhibit 5: Broader unemployment rate
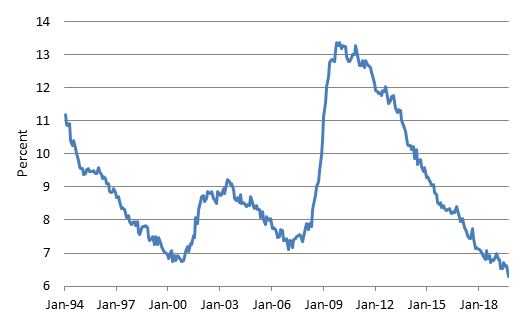
Note: unemployed + those not in LF who want a job. Source: BLS, AP Sec calculations.
Conclusion
Various measures from the BLS household survey suggest that the labor market is historically tight. Thus, it is quite plausible that a good deal of any moderation in job gains this year reflects a dearth of available workers, a story that is corroborated by the widespread complaints of businesses who are unable to fill their openings.