


Uncategorized
A surge in MBS supply should keep mortgage basis soft
admin | October 4, 2019
This document is intended for institutional investors and is not subject to all of the independence and disclosure standards applicable to debt research reports prepared for retail investors. This material does not constitute research.
The mortgage basis has widened dramatically since the start of August, reaching the widest levels since the fall of 2018. It looks likely to remain wide for the rest of the year since heavy refinancing should temporarily drive up the net supply of MBS pools. After 30-year net supply rose by $104 billion over the first eight months of the year, it looks set to jump to $161 billion for the last four months of the year. Eventually, reinvestment by current holders should bring MBS spreads in.
The mortgage basis—the spread between the mortgage current coupon and the average of the 5- and 10 year Treasury rates—widened more than 20 bp from late July until late August. The basis tightened temporarily at the end of August but quickly widened again and remained there into October. The last time the basis was this wide was fall 2018.
Exhibit 1: The mortgage basis widened significantly in August
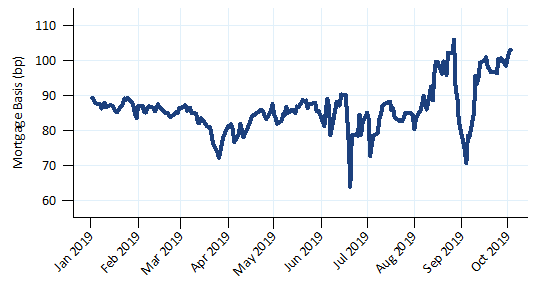
Note: The mortgage basis = (mortgage current coupon) − 0.5×(5 yr treasury + 10 yr treasury) . Source: Yield Book, Bloomberg, Amherst Pierpont Securities
Net supply should be strong through the end of the year
The net supply of MBS pools—the balance of pools issued minus the balance of paydowns—has a strong influence on the mortgage basis. Investors need to reinvest the cash received from paydowns. If the new supply of pools equals paydowns then investors receive just enough cash to purchase all of the newly issued pools. In this case the basis should arguably remain unchanged. If net supply is positive then MBS investors need to increase their MBS holdings, which should depress MBS prices and widen the basis; negative net supply suggests MBS prices should increase and the basis should tighten. This assumes that other factors, such as demand for MBS, remains unchanged.
Net supply should be much higher for the remainder of 2019. Exhibit 2 shows historical and projected MBS issuance for 2019. It also includes historical and projected Fed MBS purchasing activity, and the final column shows the net MBS supply that needs to be purchased by private investors. This number picked up in May and then jumped to $33 billion in August and should remain elevated for the remainder of the year.
Exhibit 2: Gross supply, net supply, and Fed MBS purchasing
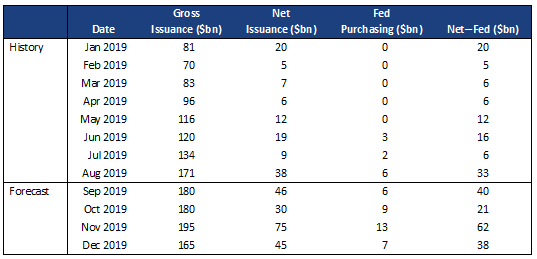
Note: Projections derived from prepayment forecasts on MBS universe and Fed MBS portfolio. Source: Fannie Mae, Freddie Mac, Ginnie Mae, eMBS, Amherst Pierpont Securities
Net supply after Fed MBS purchases for the remaining four months of the year is forecast to be $161 billion, which is far higher than the $104 billion for the first eight months of the year. The $40 billion monthly average is a large increase over August, which should support a wider basis. At current interest rates the Fed should be an MBS buyer for the next twelve months, but the levels are not high enough to have a large effect on net supply.
Net supply should increase for the rest of the year since prepayment speeds are projected to slow after October. Rates have sold off from the early-August lows, and turnover slows in the fall and winter months. But pool production tends to lag changes in prepayments, so will remain elevated while speeds slow. This will increase net supply. The opposite should happen in early 2020—as speeds increase net supply will fall.
The MBS basis often widens in the early phase of a refinancing wave before tightening later. Loans backing Fannie Mae or Freddie Mac MBS can prepay in one month, for instance, and return as cash to an investor’s portfolio the next month. A loan that prepaid on September 5, for instance, would flow into an investor’s portfolio as cash on October 25. That same loan might get pooled for October 10 regular settlement. Even though investors might be able to anticipate the prepayment and receipt of cash, many hesitate to buy for October due to uncertainty about prepayments. Supply tends to lead reinvestment demand, widening spreads early in the refinancing wave and then tightening them later.
Pools with high gross WACs are also hurting TBA pricing
Pools with high gross WACs are also hurting TBA prices and pushing the basis wider. From late 2018 until the introduction of the UMBS contract in June originators were creating pools with extremely wide spreads between the note rate of the loans in the pool and the pool’s coupon. These pools will have worse convexity than other pools of the same coupon, and these pools’ potential to be delivered has lowered TBA pricing and pushed the basis wider. The supply of these pools is large enough that they will influence TBA pricing for some time.