Uncategorized
Improved housing affordability
admin | September 27, 2019
This material is a Marketing Communication and does not constitute Independent Investment Research.
After rising for several years, home sales weakened in 2018 and early 2019. But in recent months, the demand for homes has begun to perk up again. These movements can be largely explained by a relatively simple gauge of housing affordability compiled by the National Association of Realtors.
Housing affordability defined
The National Association of Realtors (NAR) publishes an index of housing affordability. The index measures how much house the typical household can afford to buy, so that an index value of 100 indicates that the household with median income can just afford the median-priced single-family existing home.
There are three main variables that govern the NAR’s affordability index: home prices, mortgage rates, and median income. The NAR uses its own price measure from the monthly existing home sales release. The mortgage rate is the Freddie Mac 30-year mortgage rate. These two variables are used to calculate the level of the monthly principal and interest payment on a mortgage for the median-priced home. A qualifying income is then derived using a 25% ratio for monthly housing expense to gross monthly income assuming a 20% down payment. That qualifying income is then compared to the actual median family income. This measure is benchmarked to the last annual US Census on household incomes, and then estimated forward using the average of wage growth and income growth in the last year of the survey. The affordability index is the ratio of estimated median income to the qualifying income level.
Affordability Deteriorates
After holding steady in 2015 and 2016, the NAR gauge began to deteriorate in 2017 and 2018. This reflected two forces. First, home prices were rising rapidly for much of the decade. The NAR measure of existing home prices increased by 4.5% or more in each year from 2012 through 2017 before finally beginning to slow down in late-2018. Second, mortgage rates increased sharply, beginning after President Trump’s election in late-2016. For most of 2015 and 2016, 30-year mortgage rates had hovered between 3.5% and 4.0%. The rise in 2017 was modest, with the rate mainly running in a 3.80%-to-4.20% range, but borrowing rates jumped in 2018, reflecting economic optimism driven by the tax cut and faster growth, as well as a steady diet of Federal Reserve rate hikes.
By late 2018, the 30-year mortgage rate was nearing 5%. The combination of higher prices and higher borrowing costs pushed the monthly payment figure up substantially. Thus, despite solid income growth, the NAR affordability gauge slipped noticeably (Exhibit 1).
Exhibit 1: NAR housing affordability index
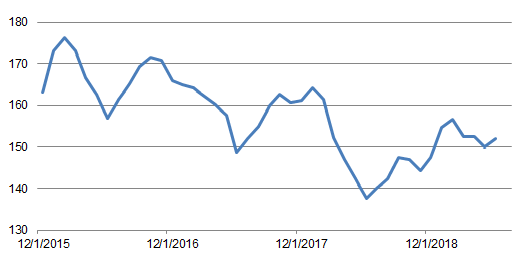
Source: National Association of Realtors, Amherst Pierpont Securities
Not surprisingly, the cumulative impact of rising prices and borrowing costs eventually took a toll on the demand for homes. After steadily rising in 2015, 2016, and well into 2017, combined new and existing home sales flattened out in 2017 and began to deteriorate in 2018 (Exhibit 2). The chart shows that home sales have tracked the NAR affordability index well over the past several years, with a lag of several months. The steep deterioration in affordability in the first half of 2018 corresponded with a substantial slowing in home sales over the course of last year.
Exhibit 2: NAR housing affordability index and home sales
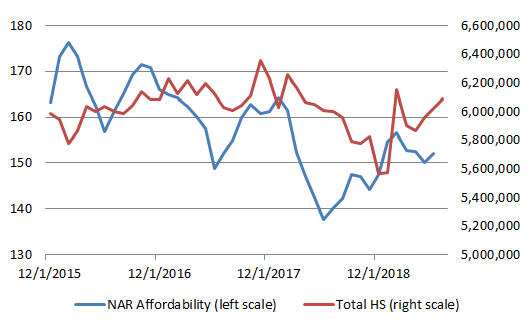
Source: National Association of Realtors, Census Bureau, Amherst Pierpont Securities
Housing turnaround
The movements in the affordability gauge also help to explain an improvement in the demand for homes in recent months. The steep drop in mortgage rates since late 2018 has cut the level of the median monthly mortgage payment, even though the NAR gauge of home prices, unlike other more prominent home price measures like FHFA and S&P/Case-Shiller, jumped in late 2018 and early 2019. In addition, the pickup in wage gains has helped to drive a faster pace of growth for the median income proxy.
The NAR affordability index bottomed out around mid-2018 and total home sales have been trending gently higher so far this year. The July-August average for home sales is up by more than 7% from the Q4 2018 average and is roughly back to the yearly average for 2017, so far the peak of the current expansion.
The NAR gauge posted an advance in July, the latest reading available, and seems likely to inch higher again in August given the further slide in mortgage rates last month. This bodes well for housing demand for the balance of 2019.
This material is intended only for institutional investors and does not carry all of the independence and disclosure standards of retail debt research reports. In the preparation of this material, the author may have consulted or otherwise discussed the matters referenced herein with one or more of SCM’s trading desks, any of which may have accumulated or otherwise taken a position, long or short, in any of the financial instruments discussed in or related to this material. Further, SCM may act as a market maker or principal dealer and may have proprietary interests that differ or conflict with the recipient hereof, in connection with any financial instrument discussed in or related to this material.
This message, including any attachments or links contained herein, is subject to important disclaimers, conditions, and disclosures regarding Electronic Communications, which you can find at https://portfolio-strategy.apsec.com/sancap-disclaimers-and-disclosures.
Important Disclaimers
Copyright © 2026 Santander US Capital Markets LLC and its affiliates (“SCM”). All rights reserved. SCM is a member of FINRA and SIPC. This material is intended for limited distribution to institutions only and is not publicly available. Any unauthorized use or disclosure is prohibited.
In making this material available, SCM (i) is not providing any advice to the recipient, including, without limitation, any advice as to investment, legal, accounting, tax and financial matters, (ii) is not acting as an advisor or fiduciary in respect of the recipient, (iii) is not making any predictions or projections and (iv) intends that any recipient to which SCM has provided this material is an “institutional investor” (as defined under applicable law and regulation, including FINRA Rule 4512 and that this material will not be disseminated, in whole or part, to any third party by the recipient.
The author of this material is an economist, desk strategist or trader. In the preparation of this material, the author may have consulted or otherwise discussed the matters referenced herein with one or more of SCM’s trading desks, any of which may have accumulated or otherwise taken a position, long or short, in any of the financial instruments discussed in or related to this material. Further, SCM or any of its affiliates may act as a market maker or principal dealer and may have proprietary interests that differ or conflict with the recipient hereof, in connection with any financial instrument discussed in or related to this material.
This material (i) has been prepared for information purposes only and does not constitute a solicitation or an offer to buy or sell any securities, related investments or other financial instruments, (ii) is neither research, a “research report” as commonly understood under the securities laws and regulations promulgated thereunder nor the product of a research department, (iii) or parts thereof may have been obtained from various sources, the reliability of which has not been verified and cannot be guaranteed by SCM, (iv) should not be reproduced or disclosed to any other person, without SCM’s prior consent and (v) is not intended for distribution in any jurisdiction in which its distribution would be prohibited.
In connection with this material, SCM (i) makes no representation or warranties as to the appropriateness or reliance for use in any transaction or as to the permissibility or legality of any financial instrument in any jurisdiction, (ii) believes the information in this material to be reliable, has not independently verified such information and makes no representation, express or implied, with regard to the accuracy or completeness of such information, (iii) accepts no responsibility or liability as to any reliance placed, or investment decision made, on the basis of such information by the recipient and (iv) does not undertake, and disclaims any duty to undertake, to update or to revise the information contained in this material.
Unless otherwise stated, the views, opinions, forecasts, valuations, or estimates contained in this material are those solely of the author, as of the date of publication of this material, and are subject to change without notice. The recipient of this material should make an independent evaluation of this information and make such other investigations as the recipient considers necessary (including obtaining independent financial advice), before transacting in any financial market or instrument discussed in or related to this material.
Important disclaimers for clients in the EU and UK
This publication has been prepared by Trading Desk Strategists within the Sales and Trading functions of Santander US Capital Markets LLC (“SanCap”), the US registered broker-dealer of Santander Corporate & Investment Banking. This communication is distributed in the EEA by Banco Santander S.A., a credit institution registered in Spain and authorised and regulated by the Bank of Spain and the CNMV. Any EEA recipient of this communication that would like to affect any transaction in any security or issuer discussed herein should do so with Banco Santander S.A. or any of its affiliates (together “Santander”). This communication has been distributed in the UK by Banco Santander, S.A.’s London branch, authorised by the Bank of Spain and subject to regulatory oversight on certain matters by the Financial Conduct Authority (FCA) and the Prudential Regulation Authority (PRA).
The publication is intended for exclusive use for Professional Clients and Eligible Counterparties as defined by MiFID II and is not intended for use by retail customers or for any persons or entities in any jurisdictions or country where such distribution or use would be contrary to local law or regulation.
This material is not a product of Santander´s Research Team and does not constitute independent investment research. This is a marketing communication and may contain ¨investment recommendations¨ as defined by the Market Abuse Regulation 596/2014 ("MAR"). This publication has not been prepared in accordance with legal requirements designed to promote the independence of research and is not subject to any prohibition on dealing ahead of the dissemination of investment research. The author, date and time of the production of this publication are as indicated herein.
This publication does not constitute investment advice and may not be relied upon to form an investment decision, nor should it be construed as any offer to sell or issue or invitation to purchase, acquire or subscribe for any instruments referred herein. The publication has been prepared in good faith and based on information Santander considers reliable as of the date of publication, but Santander does not guarantee or represent, express or implied, that such information is accurate or complete. All estimates, forecasts and opinions are current as at the date of this publication and are subject to change without notice. Unless otherwise indicated, Santander does not intend to update this publication. The views and commentary in this publication may not be objective or independent of the interests of the Trading and Sales functions of Santander, who may be active participants in the markets, investments or strategies referred to herein and/or may receive compensation from investment banking and non-investment banking services from entities mentioned herein. Santander may trade as principal, make a market or hold positions in instruments (or related derivatives) and/or hold financial interest in entities discussed herein. Santander may provide market commentary or trading strategies to other clients or engage in transactions which may differ from views expressed herein. Santander may have acted upon the contents of this publication prior to you having received it.
This publication is intended for the exclusive use of the recipient and must not be reproduced, redistributed or transmitted, in whole or in part, without Santander’s consent. The recipient agrees to keep confidential at all times information contained herein.


