Uncategorized
A challenge from lagging spreads
admin | September 27, 2019
This material is a Marketing Communication and does not constitute Independent Investment Research.
CLOs have had a tough time in recent years keeping up with spreads on most competing corporate and structured products, with the gap generally widening with each step down in rating. Wider leveraged loan spreads have weighed on CLOs and look likely to continue adding drag until US growth stabilizes. The issue: slowly weakening loan fundamentals.
Weaker performance at lower ratings
Against corporate debt, CLOs have generally widened in every rating category. ‘AAA’ CLOs, for instance, have widened against corporates since September 2017 by 27 bp, since September 2018 by 5 bp and only tightened a few basis points this year (Exhibit 1). The widening has been more pronounced with each drop in rating. Toward the lower end of the ratings scale, for instance, ‘BB’ CLOs have widened against corporates since September 2017 by 146 bp, since September 2018 by 189 bp and have continued lagging substantially this year. Although some of the widening could reflect changing preference for fixed corporate debt rather than floating CLOs, the sharper widening at lower ratings suggests concern about leveraged loan credit in particular.
Exhibit 1: CLOs generally have widened against corporate debt
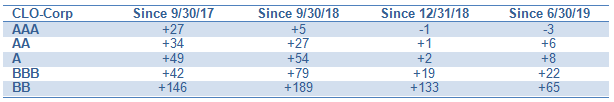
Source: ICE BofAML US Corporate and High Yield OAS, Palmer Square Indices, Amherst Pierpont Securities. A time series of spreads between CLOs and corporate debt is available here.
Against CMBS, CLOs spreads have also generally lagged with lower ratings turning in weaker performance. ‘AAA’ CLOs have widened to CMBS since late 2017 by 27 bp although tightening by single digits more recently (Exhibit 2). At lower ratings, CLOs have widened sharply since September 2017 and have largely continued widening this year. The widening could reflect shifting preference for interest rate exposure, but concern about leveraged loan credit seems likely.
Exhibit 2: CLOs have generally lagged private CMBS
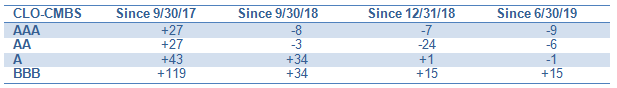
Source: Palmer Square Indices, Amherst Pierpont Securities. A time series of spreads between CLOs and corporate debt is available here.
CLOs have lagged ABS over longer horizons, tightened in the first half of this year and widened again since June (Exhibit 3). The choice of a best ABS benchmark is more difficult, but credit card ABS offers a reasonable floating-rate comparison. ‘AAA’ CLOs have lagged similarly rated 7-year credit cards. In lower rating categories, CLOs have generally lagged credit cards by even more.
Exhibit 3: CLOs have generally lagged credit card ABS
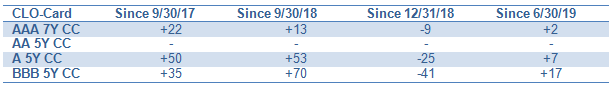
Source: Palmer Square Indices, Amherst Pierpont Securities. A time series of spreads between CLOs and corporate debt is available here.
Wider spreads in leveraged loans
The path of spreads in CLOs has roughly tracked spreads in leveraged loans: tightening briefly in late 2017, widening through 2018, tightening again in early 2019 and then running sideways since (Exhibit 4). Loan spreads broadly drive CLO spreads. At wide loan spreads, CLO managers can print viable deals with wide liabilities and drive secondary spreads wider, too. And at tight loan spreads, tight new issue CLO liabilities help tighten secondary spreads.
Exhibit 4: The average B+/B loan has widened over the last few years
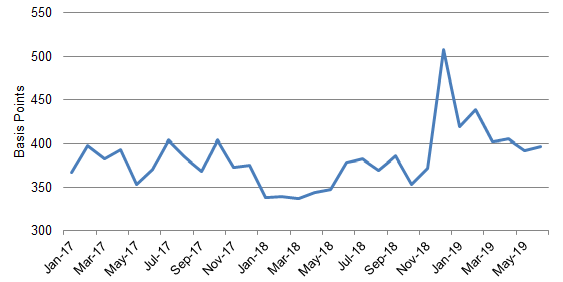
Source: S&P LCD, Amherst Pierpont Securities
A couple of factors have arguably contributed to widening in leveraged loans and still have momentum:
- Rising debt multiples. Leveraged borrowers are taking on more debt. The share of large corporate leveraged loans with a ratio of debt-to-EBITDA of 4x or greater—often the dividing line between ‘BB-‘ and ‘B+’ credit—a has run from 78% in 2017 to 93% in the second half of 2019. Strong equity markets continue to encourage the M&A and LBO activity that contributes the bulk of the most highly leveraged loans.
- Falling cash flow multiples. Leveraged borrowers also have less income to cover interest expenses. The ratio of EBIDA-to-cash-interest has dropped from 3.55x in 2017 to 3.03x in the second half of 2019, although lower interest rates since May have almost surely cut interest expense
- A high share of covenant-lite loans. The cov-lite share of new loans this year is running between 70% and 80%, and the most recent work on recoveries suggests that post-crisis cov-lite loans have had recoveries roughly 10 percentage points below historic levels.
- Other risks. The share of M&A transactions that rely on cost savings to hit financial targets has jumped from 58% in 2017 to 70% this year. Borrowers continue to explore the ability to take out marginal loans secured by the same collateral posted against the term loans owned by CLOs.
All of these issues raise risk in leveraged loans as the economy slows, and they stand to keep pressure on leveraged loan spreads until the economy shows some stability.
Spread performance is only one part of CLO total return, of course, and the generally higher yield and lower interest rate sensitivity of CLOs along with relatively low correlation to other fixed income assets still earn CLOs a place in most portfolios. Spreads, however, may not add much for now to returns.
This material is intended only for institutional investors and does not carry all of the independence and disclosure standards of retail debt research reports. In the preparation of this material, the author may have consulted or otherwise discussed the matters referenced herein with one or more of SCM’s trading desks, any of which may have accumulated or otherwise taken a position, long or short, in any of the financial instruments discussed in or related to this material. Further, SCM may act as a market maker or principal dealer and may have proprietary interests that differ or conflict with the recipient hereof, in connection with any financial instrument discussed in or related to this material.
This message, including any attachments or links contained herein, is subject to important disclaimers, conditions, and disclosures regarding Electronic Communications, which you can find at https://portfolio-strategy.apsec.com/sancap-disclaimers-and-disclosures.
Important Disclaimers
Copyright © 2026 Santander US Capital Markets LLC and its affiliates (“SCM”). All rights reserved. SCM is a member of FINRA and SIPC. This material is intended for limited distribution to institutions only and is not publicly available. Any unauthorized use or disclosure is prohibited.
In making this material available, SCM (i) is not providing any advice to the recipient, including, without limitation, any advice as to investment, legal, accounting, tax and financial matters, (ii) is not acting as an advisor or fiduciary in respect of the recipient, (iii) is not making any predictions or projections and (iv) intends that any recipient to which SCM has provided this material is an “institutional investor” (as defined under applicable law and regulation, including FINRA Rule 4512 and that this material will not be disseminated, in whole or part, to any third party by the recipient.
The author of this material is an economist, desk strategist or trader. In the preparation of this material, the author may have consulted or otherwise discussed the matters referenced herein with one or more of SCM’s trading desks, any of which may have accumulated or otherwise taken a position, long or short, in any of the financial instruments discussed in or related to this material. Further, SCM or any of its affiliates may act as a market maker or principal dealer and may have proprietary interests that differ or conflict with the recipient hereof, in connection with any financial instrument discussed in or related to this material.
This material (i) has been prepared for information purposes only and does not constitute a solicitation or an offer to buy or sell any securities, related investments or other financial instruments, (ii) is neither research, a “research report” as commonly understood under the securities laws and regulations promulgated thereunder nor the product of a research department, (iii) or parts thereof may have been obtained from various sources, the reliability of which has not been verified and cannot be guaranteed by SCM, (iv) should not be reproduced or disclosed to any other person, without SCM’s prior consent and (v) is not intended for distribution in any jurisdiction in which its distribution would be prohibited.
In connection with this material, SCM (i) makes no representation or warranties as to the appropriateness or reliance for use in any transaction or as to the permissibility or legality of any financial instrument in any jurisdiction, (ii) believes the information in this material to be reliable, has not independently verified such information and makes no representation, express or implied, with regard to the accuracy or completeness of such information, (iii) accepts no responsibility or liability as to any reliance placed, or investment decision made, on the basis of such information by the recipient and (iv) does not undertake, and disclaims any duty to undertake, to update or to revise the information contained in this material.
Unless otherwise stated, the views, opinions, forecasts, valuations, or estimates contained in this material are those solely of the author, as of the date of publication of this material, and are subject to change without notice. The recipient of this material should make an independent evaluation of this information and make such other investigations as the recipient considers necessary (including obtaining independent financial advice), before transacting in any financial market or instrument discussed in or related to this material.
Important disclaimers for clients in the EU and UK
This publication has been prepared by Trading Desk Strategists within the Sales and Trading functions of Santander US Capital Markets LLC (“SanCap”), the US registered broker-dealer of Santander Corporate & Investment Banking. This communication is distributed in the EEA by Banco Santander S.A., a credit institution registered in Spain and authorised and regulated by the Bank of Spain and the CNMV. Any EEA recipient of this communication that would like to affect any transaction in any security or issuer discussed herein should do so with Banco Santander S.A. or any of its affiliates (together “Santander”). This communication has been distributed in the UK by Banco Santander, S.A.’s London branch, authorised by the Bank of Spain and subject to regulatory oversight on certain matters by the Financial Conduct Authority (FCA) and the Prudential Regulation Authority (PRA).
The publication is intended for exclusive use for Professional Clients and Eligible Counterparties as defined by MiFID II and is not intended for use by retail customers or for any persons or entities in any jurisdictions or country where such distribution or use would be contrary to local law or regulation.
This material is not a product of Santander´s Research Team and does not constitute independent investment research. This is a marketing communication and may contain ¨investment recommendations¨ as defined by the Market Abuse Regulation 596/2014 ("MAR"). This publication has not been prepared in accordance with legal requirements designed to promote the independence of research and is not subject to any prohibition on dealing ahead of the dissemination of investment research. The author, date and time of the production of this publication are as indicated herein.
This publication does not constitute investment advice and may not be relied upon to form an investment decision, nor should it be construed as any offer to sell or issue or invitation to purchase, acquire or subscribe for any instruments referred herein. The publication has been prepared in good faith and based on information Santander considers reliable as of the date of publication, but Santander does not guarantee or represent, express or implied, that such information is accurate or complete. All estimates, forecasts and opinions are current as at the date of this publication and are subject to change without notice. Unless otherwise indicated, Santander does not intend to update this publication. The views and commentary in this publication may not be objective or independent of the interests of the Trading and Sales functions of Santander, who may be active participants in the markets, investments or strategies referred to herein and/or may receive compensation from investment banking and non-investment banking services from entities mentioned herein. Santander may trade as principal, make a market or hold positions in instruments (or related derivatives) and/or hold financial interest in entities discussed herein. Santander may provide market commentary or trading strategies to other clients or engage in transactions which may differ from views expressed herein. Santander may have acted upon the contents of this publication prior to you having received it.
This publication is intended for the exclusive use of the recipient and must not be reproduced, redistributed or transmitted, in whole or in part, without Santander’s consent. The recipient agrees to keep confidential at all times information contained herein.


