Uncategorized
Tracking credit performance in non-QM
admin | September 20, 2019
This material is a Marketing Communication and does not constitute Independent Investment Research.
Performance on loans backing non-QM MBS has been relatively pristine so far, marked by fast prepayments and low default rates. The confluence of rising home prices, low interest rates and a steady grind tighter in risk-based pricing have provided a strong tailwind to performance. Issuer calls also have helped as seriously delinquent loans have been called at par by issuers, insulating investors from potential losses. In fact, the overwhelming majority of seriously delinquent loans leaving non-QM trusts have generated no losses either because of a par call or a sufficient cushion of borrower equity.
Non-QM shows strong credit performance
Over the past two years, only 390 loans totaling $165 million in principal have gone into serious delinquency, foreclosure or have liquidated. Of these loans, roughly 75% are in some late stage of delinquency or foreclosure with the remainder having liquidated. This translates to very low delinquency rates across non-QM trusts with many trusts exhibiting no late-stage delinquencies at all.
Exhibit 1: Delinquency and default rates across the universe of non-QM trusts
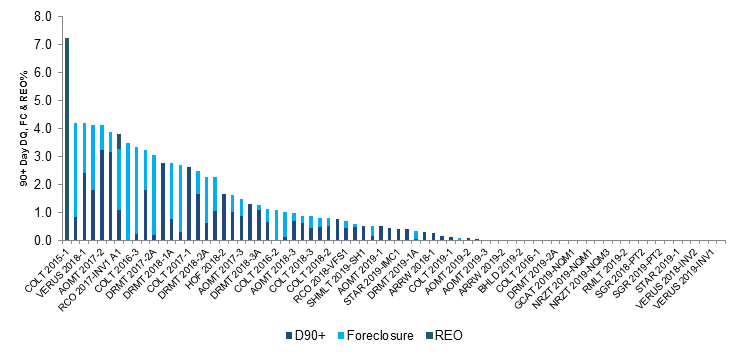
Source: Bloomberg, Amherst Pierpont Securities
Tracking transitions
The majority of early- or late-stage delinquencies in the last two years have either prepaid or been called. An overwhelming majority of loans that were current or 30-days past due have prepaid or been called. Just over one quarter of loans that have gone 60-days delinquent, calculated using the MBA methodology, have rolled back to current, with roughly two-thirds having prepaid or been called. Of loans 90-days or more past due, roughly 20% have prepaid and more than half of them have been called. Across the entire universe of non-QM loans one fifth of all loans have been called and over half have prepaid. (Exhibit 2)
Exhibit 2: Two-year transition matrix of non-QM loans by delinquency status
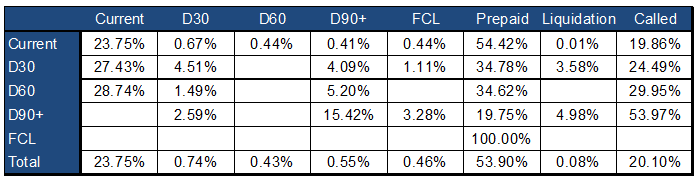
Source: Amherst Insight Labs, Amherst Pierpont Securities
Sizing up severities
Of the roughly $ 41 million in seriously delinquent loans leaving non-QM trusts, nearly $40 million have not generated a loss to the trust, a phenomenon we have observed in the legacy market and dubbed a no-loss liquidation. Drilling into these loans, $31 million were 90+ MBA delinquent when they left their various trusts while an additional $8.4 million were either in foreclosure or REO. Just over $16 million of seriously delinquent loans that abated were a result of issuer calls and had a mark-market LTV of 77. An additional $23 million of loans defaulted and liquidated without generating a loss to the trust. These loans had roughly 30 points of borrower equity when they left their respective trusts, ostensibly enough to more than cover any foreclosure discount and associated liquidation costs. (Exhibit 3)
Exhibit 3: Issuer calls and borrower equity cushion against losses on delinquent loans
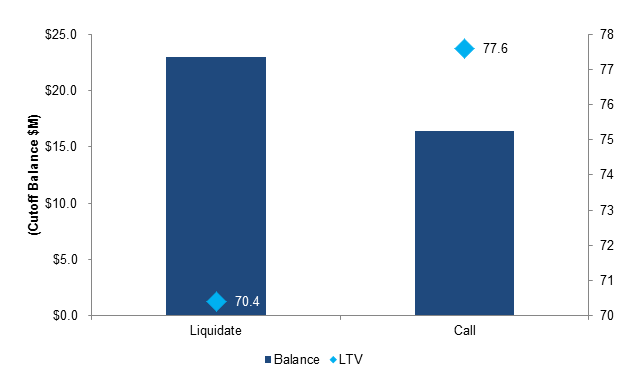
Source: Amherst Insight Labs, Amherst Pierpont Securities
Characteristics of delinquencies
Characteristics of delinquent loans in non-QM trusts generally exhibit characteristics consistent with riskier loans with the exception of occupancy where owner occupied homes make up a disproportionately larger amount of delinquencies than investor loans or second homes. Lower delinquencies on investor homes appear to be a function of compensating credit characteristics as delinquent owner occupied loans has higher LTVs and lower FICOs than other occupancy types. Limited documentation loans make up a disproportionately large amount of total delinquencies, with LTVs roughly in line with delinquent full documentation loans with modestly higher, albeit subprime FICO scores. (Exhibit 4)
Exhibit 4: Profile of non-QM delinquencies by documentation and occupancy
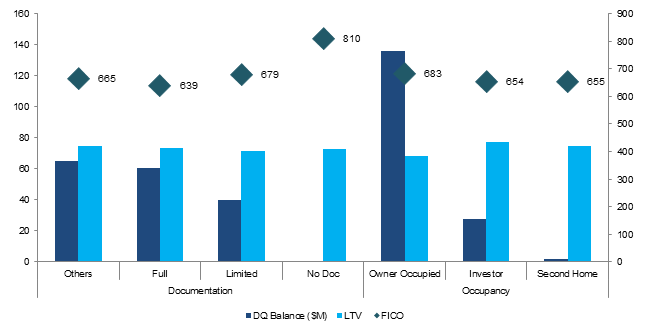
Source: Amherst Insight Labs, Amherst Pierpont Securities
While credit performance to date has been pristine, these loans have yet to be tested against the backdrop of lower home prices and a weakening economy. Certain types of non-QM loans like no income loans written against the debt service coverage ratio of an investor property have little to no performance history into a downturn in home prices and may likely pose increased risk to investors if the economy stalls or home prices decline.
This material is intended only for institutional investors and does not carry all of the independence and disclosure standards of retail debt research reports. In the preparation of this material, the author may have consulted or otherwise discussed the matters referenced herein with one or more of SCM’s trading desks, any of which may have accumulated or otherwise taken a position, long or short, in any of the financial instruments discussed in or related to this material. Further, SCM may act as a market maker or principal dealer and may have proprietary interests that differ or conflict with the recipient hereof, in connection with any financial instrument discussed in or related to this material.
This message, including any attachments or links contained herein, is subject to important disclaimers, conditions, and disclosures regarding Electronic Communications, which you can find at https://portfolio-strategy.apsec.com/sancap-disclaimers-and-disclosures.
Important Disclaimers
Copyright © 2026 Santander US Capital Markets LLC and its affiliates (“SCM”). All rights reserved. SCM is a member of FINRA and SIPC. This material is intended for limited distribution to institutions only and is not publicly available. Any unauthorized use or disclosure is prohibited.
In making this material available, SCM (i) is not providing any advice to the recipient, including, without limitation, any advice as to investment, legal, accounting, tax and financial matters, (ii) is not acting as an advisor or fiduciary in respect of the recipient, (iii) is not making any predictions or projections and (iv) intends that any recipient to which SCM has provided this material is an “institutional investor” (as defined under applicable law and regulation, including FINRA Rule 4512 and that this material will not be disseminated, in whole or part, to any third party by the recipient.
The author of this material is an economist, desk strategist or trader. In the preparation of this material, the author may have consulted or otherwise discussed the matters referenced herein with one or more of SCM’s trading desks, any of which may have accumulated or otherwise taken a position, long or short, in any of the financial instruments discussed in or related to this material. Further, SCM or any of its affiliates may act as a market maker or principal dealer and may have proprietary interests that differ or conflict with the recipient hereof, in connection with any financial instrument discussed in or related to this material.
This material (i) has been prepared for information purposes only and does not constitute a solicitation or an offer to buy or sell any securities, related investments or other financial instruments, (ii) is neither research, a “research report” as commonly understood under the securities laws and regulations promulgated thereunder nor the product of a research department, (iii) or parts thereof may have been obtained from various sources, the reliability of which has not been verified and cannot be guaranteed by SCM, (iv) should not be reproduced or disclosed to any other person, without SCM’s prior consent and (v) is not intended for distribution in any jurisdiction in which its distribution would be prohibited.
In connection with this material, SCM (i) makes no representation or warranties as to the appropriateness or reliance for use in any transaction or as to the permissibility or legality of any financial instrument in any jurisdiction, (ii) believes the information in this material to be reliable, has not independently verified such information and makes no representation, express or implied, with regard to the accuracy or completeness of such information, (iii) accepts no responsibility or liability as to any reliance placed, or investment decision made, on the basis of such information by the recipient and (iv) does not undertake, and disclaims any duty to undertake, to update or to revise the information contained in this material.
Unless otherwise stated, the views, opinions, forecasts, valuations, or estimates contained in this material are those solely of the author, as of the date of publication of this material, and are subject to change without notice. The recipient of this material should make an independent evaluation of this information and make such other investigations as the recipient considers necessary (including obtaining independent financial advice), before transacting in any financial market or instrument discussed in or related to this material.
Important disclaimers for clients in the EU and UK
This publication has been prepared by Trading Desk Strategists within the Sales and Trading functions of Santander US Capital Markets LLC (“SanCap”), the US registered broker-dealer of Santander Corporate & Investment Banking. This communication is distributed in the EEA by Banco Santander S.A., a credit institution registered in Spain and authorised and regulated by the Bank of Spain and the CNMV. Any EEA recipient of this communication that would like to affect any transaction in any security or issuer discussed herein should do so with Banco Santander S.A. or any of its affiliates (together “Santander”). This communication has been distributed in the UK by Banco Santander, S.A.’s London branch, authorised by the Bank of Spain and subject to regulatory oversight on certain matters by the Financial Conduct Authority (FCA) and the Prudential Regulation Authority (PRA).
The publication is intended for exclusive use for Professional Clients and Eligible Counterparties as defined by MiFID II and is not intended for use by retail customers or for any persons or entities in any jurisdictions or country where such distribution or use would be contrary to local law or regulation.
This material is not a product of Santander´s Research Team and does not constitute independent investment research. This is a marketing communication and may contain ¨investment recommendations¨ as defined by the Market Abuse Regulation 596/2014 ("MAR"). This publication has not been prepared in accordance with legal requirements designed to promote the independence of research and is not subject to any prohibition on dealing ahead of the dissemination of investment research. The author, date and time of the production of this publication are as indicated herein.
This publication does not constitute investment advice and may not be relied upon to form an investment decision, nor should it be construed as any offer to sell or issue or invitation to purchase, acquire or subscribe for any instruments referred herein. The publication has been prepared in good faith and based on information Santander considers reliable as of the date of publication, but Santander does not guarantee or represent, express or implied, that such information is accurate or complete. All estimates, forecasts and opinions are current as at the date of this publication and are subject to change without notice. Unless otherwise indicated, Santander does not intend to update this publication. The views and commentary in this publication may not be objective or independent of the interests of the Trading and Sales functions of Santander, who may be active participants in the markets, investments or strategies referred to herein and/or may receive compensation from investment banking and non-investment banking services from entities mentioned herein. Santander may trade as principal, make a market or hold positions in instruments (or related derivatives) and/or hold financial interest in entities discussed herein. Santander may provide market commentary or trading strategies to other clients or engage in transactions which may differ from views expressed herein. Santander may have acted upon the contents of this publication prior to you having received it.
This publication is intended for the exclusive use of the recipient and must not be reproduced, redistributed or transmitted, in whole or in part, without Santander’s consent. The recipient agrees to keep confidential at all times information contained herein.


