Uncategorized
Spread compensation per turn of leverage in IG corporates
admin | September 20, 2019
This material is a Marketing Communication and does not constitute Independent Investment Research.
Much has been made over the past several years about the increasing leverage on corporate balance sheets, due in large part to the accommodative rate environment. The past several months has seen this trend continue, as the flattening of the long-end of the yield curve in the four months that preceded September fueled a fresh round of opportunistic debt issuance from investment grade corporates.
Management teams have become more aggressive, terming out their maturity schedules further, and targeting additional higher coupon debt for early redemption to help pare down interest expenses. As a result of these actions, the amount of aggregate debt in 10+ year debt increased drastically to 34.4% from 28.5% over the past 5 years. Similarly, the amount of 3- to 5-year debt on corporate balance sheets decreased from 20.7% to 16.5%.
Investment grade universe tilts towards lower-rated credit
Also well documented has been the increase of lower-rated credit—specifically BBB credit—as a portion of the overall IG universe. Five years ago, BBB debt made up 42% of the IG Index, versus 45% for single-A and 11% for AA; and just 1% remaining in AAA with few issuers still seeing the top rating category as beneficial. The relative amount of BBB debt has risen ~17% to 49% of the entire IG Index, while single-A has declined to 41% and double-A to 8%. Even within the broader rating categories, issuers have moved further out the credit spectrum, as BBB- has increased to roughly 12% from 9% just 5 years ago and mid-BBB has risen to 19.5% from 16%.
Exhibit 1: Historical spread of BBB versus A- and AA-rated corporate debt
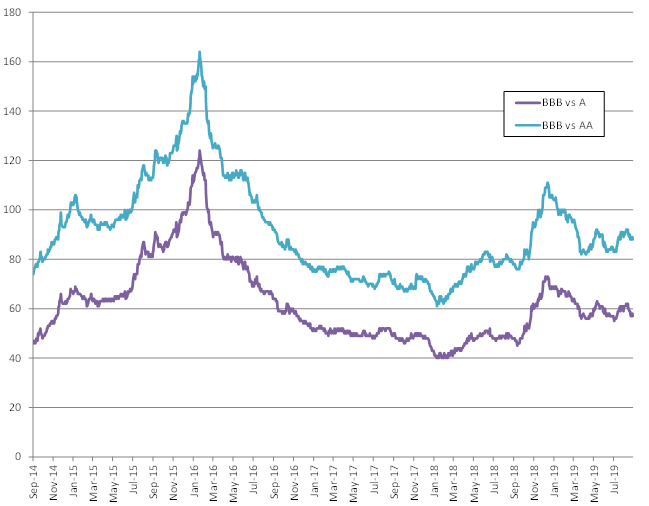
Note: The Bloomberg Barclays Corp IG Index is used as a proxy for aggregate corporate debt. Source: Bloomberg, Amherst Pierpont Securities
Investors have gotten more comfortable taking on additional credit risk, and therefore higher overall leverage in their IG investments (Exhibit 1). It’s possible to gauge how much investors are being compensated for leverage across the credit curve by evaluating the spread per turn of leverage.
First, leverage is assessed for each investment grade sector, across 5-, 10- and 30-year duration buckets (Exhibit 2). It is not surprising that the utilities sector, which includes electric and natural gas issuers, carries substantially more leverage than the rest of the IG Index, given the regulated and therefore highly consistent nature of cash flows relative to the rest of the non-financial Index.
Exhibit 2: Average gross and net leverage by sector, across the curve
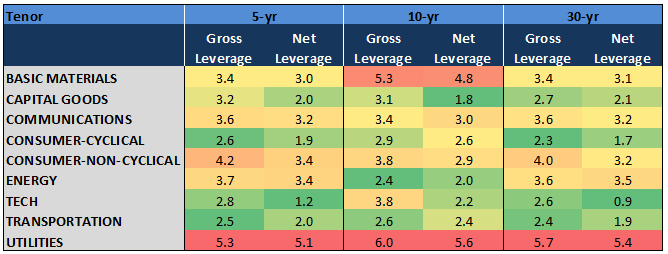
Note: For the purposes of the sample, all members of the IG Index in each respective sector and bucket are used, excluding private companies without readily available financial data, or companies that do not report traditional EBITDA figures. The debt issues are otherwise exhaustive for each category. Financials were excluded as leverage is not calculated on a debt-to-cash flow basis for all industries; and perhaps more importantly, the biggest issuers (notably money center banks) have largely moved in the opposite direction over the past decade, raising capital and reducing systemic leverage. Calculations are made using Total and Net Debt to EBITDA, weighted by individual issuer par amount outstanding. Leverage calculated with no additional adjustments made for leases, pensions or other non-debt components of leverage. Excludes autos and other issuers with large finance operations, but utilizes an estimated leverage figure for GE. Likewise, index-eligible secured debt, such as EETC pass-thrus, are excluded. Source: Bloomberg Barclays US Corp Index, Bloomberg Company Financials, Amherst Pierpont Securities
Spread per turn of leverage varies by sector and across the curve (Exhibit 3). Once again, it should be expected that the mostly regulated utilities sector is going to compensate investors less per turn of debt leverage relative to the rest of the IG Index. Also note that each duration bucket will contain a different cohort of issuers, which can have considerable influence over the aggregate debt compensation. Typically the higher risk issuers will be more limited in their ability to issue longer-term debt without exhibiting a substantially steeper spread curve.
Exhibit 3: Spread compensation per turn of leverage
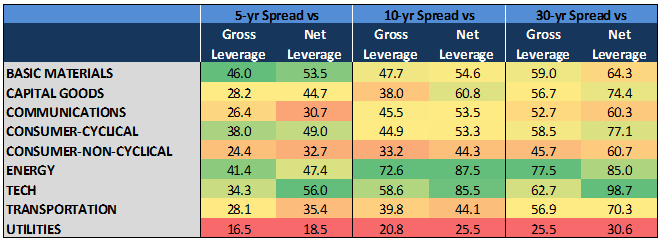
Note: Calculations are made using weighted aggregate bond G-spreads versus the Total and Net Debt-to-EBITDA. Leverage calculated with no additional adjustments made for leases, pensions or other non-debt components of leverage. Excludes autos and other issuers with large finance operations, but utilizes an estimated leverage figure for GE. Likewise, index-eligible secured debt, such as EETC pass-thrus, are excluded. Source: Bloomberg Barclays US Corp Index, Bloomberg Company Financials, Amherst Pierpont Securities
Obviously, leverage is only one factor in determining valuation. The use of exclusively Index eligible bonds in specific on-the-run duration buckets helps limit the liquidity and dollar price influences on bond valuation. And while leverage is just one piece of the puzzle, it is a big one and serves as a good starting point and accurate proxy in guiding investors as to how much risk compensation is available for each additional turn.
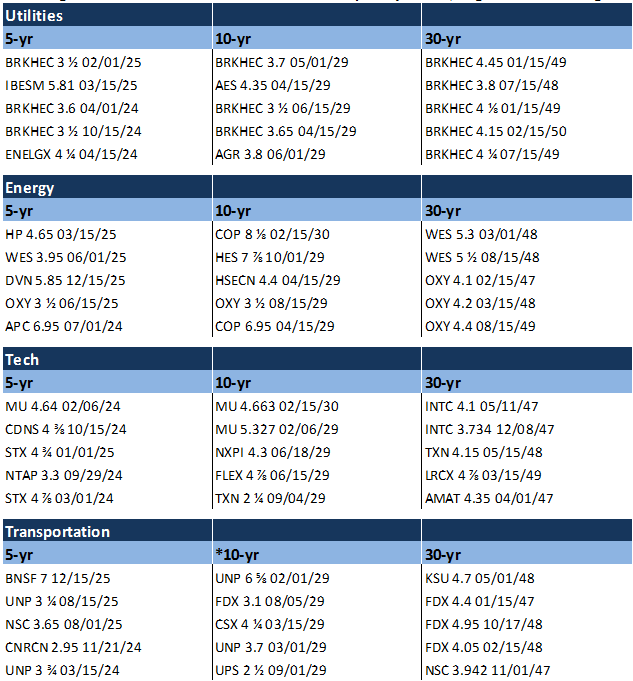
Exhibit 4: Top 5 issues – spread-to-net leverage
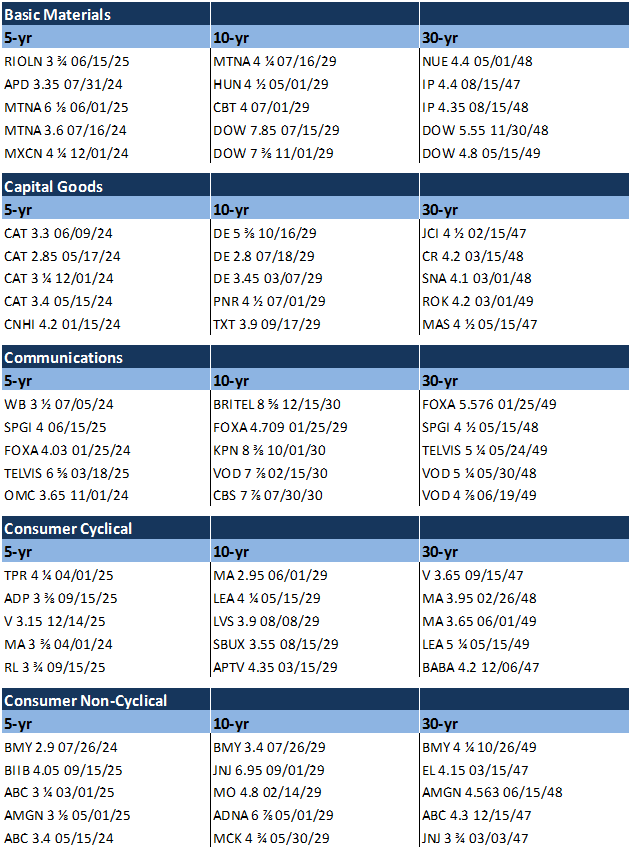
Note: Leverage calculated with no additional adjustments made for leases, pensions or other non-debt components of leverage. Excludes autos and other issuers with large finance operations, but utilizes an estimated leverage figure for GE. Likewise index-eligible secured debt, such as EETC pass-thrus, is excluded. Source: Bloomberg Barclays US Corp Index, Bloomberg Company Financials, Amherst Pierpont Securities.
Exhibit 5: Top 5 issues – spread to gross leverage
Note: Gross figures utilized for these sectors due to frequency of low/negative net leverage. Extremely limited 10-year rail issuance. Leverage calculated with no additional adjustments made for leases, pensions or other non-debt components of leverage. Excludes autos and other issuers with large finance operations, but utilizes an estimated leverage figure for GE. Likewise index-eligible secured debt, such as EETC pass-thrus, is excluded. Source: Bloomberg Barclays US Corp Index, Bloomberg Company Financials, Amherst Pierpont Securities.
This material is intended only for institutional investors and does not carry all of the independence and disclosure standards of retail debt research reports. In the preparation of this material, the author may have consulted or otherwise discussed the matters referenced herein with one or more of SCM’s trading desks, any of which may have accumulated or otherwise taken a position, long or short, in any of the financial instruments discussed in or related to this material. Further, SCM may act as a market maker or principal dealer and may have proprietary interests that differ or conflict with the recipient hereof, in connection with any financial instrument discussed in or related to this material.
This message, including any attachments or links contained herein, is subject to important disclaimers, conditions, and disclosures regarding Electronic Communications, which you can find at https://portfolio-strategy.apsec.com/sancap-disclaimers-and-disclosures.
Important Disclaimers
Copyright © 2026 Santander US Capital Markets LLC and its affiliates (“SCM”). All rights reserved. SCM is a member of FINRA and SIPC. This material is intended for limited distribution to institutions only and is not publicly available. Any unauthorized use or disclosure is prohibited.
In making this material available, SCM (i) is not providing any advice to the recipient, including, without limitation, any advice as to investment, legal, accounting, tax and financial matters, (ii) is not acting as an advisor or fiduciary in respect of the recipient, (iii) is not making any predictions or projections and (iv) intends that any recipient to which SCM has provided this material is an “institutional investor” (as defined under applicable law and regulation, including FINRA Rule 4512 and that this material will not be disseminated, in whole or part, to any third party by the recipient.
The author of this material is an economist, desk strategist or trader. In the preparation of this material, the author may have consulted or otherwise discussed the matters referenced herein with one or more of SCM’s trading desks, any of which may have accumulated or otherwise taken a position, long or short, in any of the financial instruments discussed in or related to this material. Further, SCM or any of its affiliates may act as a market maker or principal dealer and may have proprietary interests that differ or conflict with the recipient hereof, in connection with any financial instrument discussed in or related to this material.
This material (i) has been prepared for information purposes only and does not constitute a solicitation or an offer to buy or sell any securities, related investments or other financial instruments, (ii) is neither research, a “research report” as commonly understood under the securities laws and regulations promulgated thereunder nor the product of a research department, (iii) or parts thereof may have been obtained from various sources, the reliability of which has not been verified and cannot be guaranteed by SCM, (iv) should not be reproduced or disclosed to any other person, without SCM’s prior consent and (v) is not intended for distribution in any jurisdiction in which its distribution would be prohibited.
In connection with this material, SCM (i) makes no representation or warranties as to the appropriateness or reliance for use in any transaction or as to the permissibility or legality of any financial instrument in any jurisdiction, (ii) believes the information in this material to be reliable, has not independently verified such information and makes no representation, express or implied, with regard to the accuracy or completeness of such information, (iii) accepts no responsibility or liability as to any reliance placed, or investment decision made, on the basis of such information by the recipient and (iv) does not undertake, and disclaims any duty to undertake, to update or to revise the information contained in this material.
Unless otherwise stated, the views, opinions, forecasts, valuations, or estimates contained in this material are those solely of the author, as of the date of publication of this material, and are subject to change without notice. The recipient of this material should make an independent evaluation of this information and make such other investigations as the recipient considers necessary (including obtaining independent financial advice), before transacting in any financial market or instrument discussed in or related to this material.
Important disclaimers for clients in the EU and UK
This publication has been prepared by Trading Desk Strategists within the Sales and Trading functions of Santander US Capital Markets LLC (“SanCap”), the US registered broker-dealer of Santander Corporate & Investment Banking. This communication is distributed in the EEA by Banco Santander S.A., a credit institution registered in Spain and authorised and regulated by the Bank of Spain and the CNMV. Any EEA recipient of this communication that would like to affect any transaction in any security or issuer discussed herein should do so with Banco Santander S.A. or any of its affiliates (together “Santander”). This communication has been distributed in the UK by Banco Santander, S.A.’s London branch, authorised by the Bank of Spain and subject to regulatory oversight on certain matters by the Financial Conduct Authority (FCA) and the Prudential Regulation Authority (PRA).
The publication is intended for exclusive use for Professional Clients and Eligible Counterparties as defined by MiFID II and is not intended for use by retail customers or for any persons or entities in any jurisdictions or country where such distribution or use would be contrary to local law or regulation.
This material is not a product of Santander´s Research Team and does not constitute independent investment research. This is a marketing communication and may contain ¨investment recommendations¨ as defined by the Market Abuse Regulation 596/2014 ("MAR"). This publication has not been prepared in accordance with legal requirements designed to promote the independence of research and is not subject to any prohibition on dealing ahead of the dissemination of investment research. The author, date and time of the production of this publication are as indicated herein.
This publication does not constitute investment advice and may not be relied upon to form an investment decision, nor should it be construed as any offer to sell or issue or invitation to purchase, acquire or subscribe for any instruments referred herein. The publication has been prepared in good faith and based on information Santander considers reliable as of the date of publication, but Santander does not guarantee or represent, express or implied, that such information is accurate or complete. All estimates, forecasts and opinions are current as at the date of this publication and are subject to change without notice. Unless otherwise indicated, Santander does not intend to update this publication. The views and commentary in this publication may not be objective or independent of the interests of the Trading and Sales functions of Santander, who may be active participants in the markets, investments or strategies referred to herein and/or may receive compensation from investment banking and non-investment banking services from entities mentioned herein. Santander may trade as principal, make a market or hold positions in instruments (or related derivatives) and/or hold financial interest in entities discussed herein. Santander may provide market commentary or trading strategies to other clients or engage in transactions which may differ from views expressed herein. Santander may have acted upon the contents of this publication prior to you having received it.
This publication is intended for the exclusive use of the recipient and must not be reproduced, redistributed or transmitted, in whole or in part, without Santander’s consent. The recipient agrees to keep confidential at all times information contained herein.


