Uncategorized
Rising prepayment speeds ahead
admin | September 13, 2019
This material is a Marketing Communication and does not constitute Independent Investment Research.
MBS prepayments rose in August in a precursor to faster prints in September and beyond. Sharply lower interest rates should keep driving speeds up into the fall. Even with 10-year yields up nearly 40 bp since the start of this month, primary mortgage rates have only moved up 4 bp. Newer Fannie Mae and Freddie Mac pools have started to show some speed differences, with Freddie Mac speeds leading the way. And Ginnie Mae’s highest coupons have jumped well ahead of their conventional counterparts. MBS investors have plenty of prepayment volatility ahead.
Learning from recent history
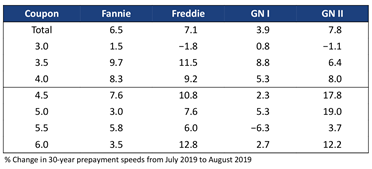
Fannie Mae 30-year speeds increased 6.5% to 17.4 CPR from 16.4 CPR and Freddie Mac 30-year speeds increased 7.1% to 17.8 CPR from 16.8 CPR, both in-line with expectations (Exhibit 1). Overall Ginnie Mae speeds also met expectations, with Ginnie I speeds up 3.9% to 15.4 CPR from 14.9 CPR and Ginnie II speeds jumping 7.8% to 22.5 CPR from 21.1 CPR.
Exhibit 1: August prepayment speeds edged faster
Source: Fannie Mae, Freddie Mac, Ginnie Mae, eMBS, Amherst Pierpont Securities
The Fannie Mae and Freddie Mac numbers
In aggregate the two GSEs’ speeds increased by comparable amounts, so overall Freddie speeds remained a bit faster than Fannie speeds. The difference is largest on newer cohorts; 2017, 2018, and 2019 vintage Freddie cohorts generally prepay faster. For example one of the largest differences came in the 4.0%s of 2019; the Freddie cohort increased 13.3% and reached 28.8 CPR, while the Fannie cohort was almost unchanged at 24.9 CPR.
Ginnie Mae super-premiums jump more than conventionals
Overall Ginnie Mae speeds moved similarly to conventionals, but higher coupon Ginnie IIs picked up quite a bit more. For example, overall G2 4.5%s jumped 17.8% while Fannie 4.5%s increased only 7.6%. This is coming form 2019 vintage pools that have been prepaying very slowly but are suddenly jumping past conventionals. For example, Ginnie II 4.5%s 2019 printed 9.8 CPR in July and 21.0 CPR in August, while Fannie 4.5%s printed 24.7 CPR in July and 24.9 CPR in August.
The surge reflects FHA and VA both enforcing seasoning requirements on refinances. The FHA requires six months seasoning on the original loan before it can use the streamlined refinance program. The VA requires seven months for any refinance. The government agencies can enforce this requirement regardless of the lender used to do the refinance.
Most conventional lenders have a similar policy, but it is much harder to enforce when a borrower changes lenders or uses a broker or correspondent lender. A lender’s retail employees must abide by any seasoning requirement, but a third-party originator, like a broker, could easily refinance a loan with a different lender. It would be up to various lenders to monitor the behavior of their broker and correspondent partners in order to control adverse behavior.
Lower coupons aren’t experiencing this yet since those loans are newer. But as the 2019 3.0%s and 3.5%s season they will likely begin to prepay much faster than those conventional cohorts. Therefore investors should be cautious about 2019 vintage Ginnie pools that might be prepaying really slowly but are on the verge of spiking much faster.
The future
August’s sharply lower interest rates should spur heavy refinancing in September and October. September is a short month with two fewer business days, however, and typically marks the start of the fall seasonal slowdown. The shorter month and seasonal slowdown should mute refinancing, with overall speeds rising only 0% to 5% over August. But the aggregate increase doesn’t tell the whole picture—newer 30-year 3.0%s and 3.5%s should prepay a fair bit faster.
Speeds in October (November report) should increase another 10% to 15% over September since there are 2.5 additional business days. Refinancing should increase in some of the more seasoned vintages with longer timelines from rate lock to closing.
Slightly more than half the market is refinanceable
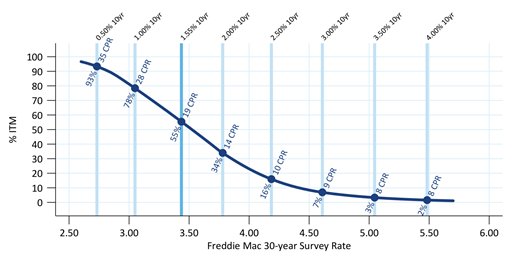
Slightly more than half the MBS market is in-the-money to refinance, meaning it has at least 75 bp of rate incentive. While this proportion sounds like a lot, prepayment speeds should remain well below the peak speeds seen in late 2012 and early 2013. Projected aggregate prepayment speeds across a range of interest rate scenarios shows roughly 19 CPR when the 10-year Treasury rate is at 1.55% and primary rates are just under 3.50% (Exhibit 2). These speeds would be consistent with the refi waves of early-2015 and mid-2016. In order to reach the speeds seen in 2012 (roughly 30 CPR) the 10-year Treasury rate would need to fall to about 1.0%.
Exhibit 2: More than half of MBS are in-the-money at current rates
Source: Fannie Mae, Freddie Mac, eMBS, Amherst Pierpont Securities
For prepayment speeds to reach the level seen in late 2012 and early 2013 the 10-year Treasury rate would need to drop to roughly 1.0%. The mortgage market should be roughly 80% in-the-money, the Freddie survey rate should be about 2.70%, and the MBS current coupon would be 2.0%s. Prepayment speeds would reach roughly 30 CPR at those rates.
The MBA refinance index has matched 2016 levels but remains well below 2012
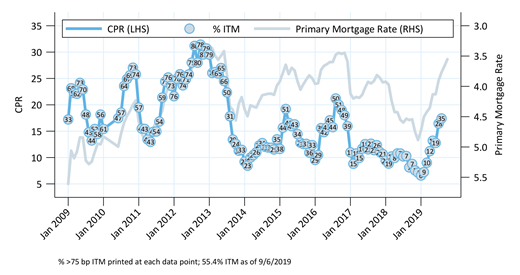
The MBA refinance index provides evidence that rates need to rally further in order for prepayments to reach 2012 levels and that the current refi environment is comparable to the 2015 and 2016 refi waves. The index recently peaked at 2,754.70 on August 16, which is comparable to the peak levels seen in early 2015 and mid-2016. Exhibit 3 shows that in both those periods the market was roughly 50% in-the-money and prepayment speeds were roughly 20 CPR. The percent refinanceable is shown by the numbers inside the circles and the prepayment speed is plotted on the left-hand axis. On October 12, 2012 the refi index reached 5,912.99 (roughly 115% higher than the recent peak), over 80% of loans were in-the-money and aggregate prepayment speeds topped 30 CPR.
Exhibit 3: Historical CPR and % in-the-money over time
Source: Fannie Mae, Freddie Mac, eMBS, Amherst Pierpont Securities
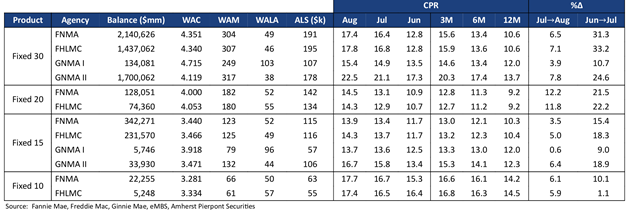
Exhibit 4: Prepayment summary
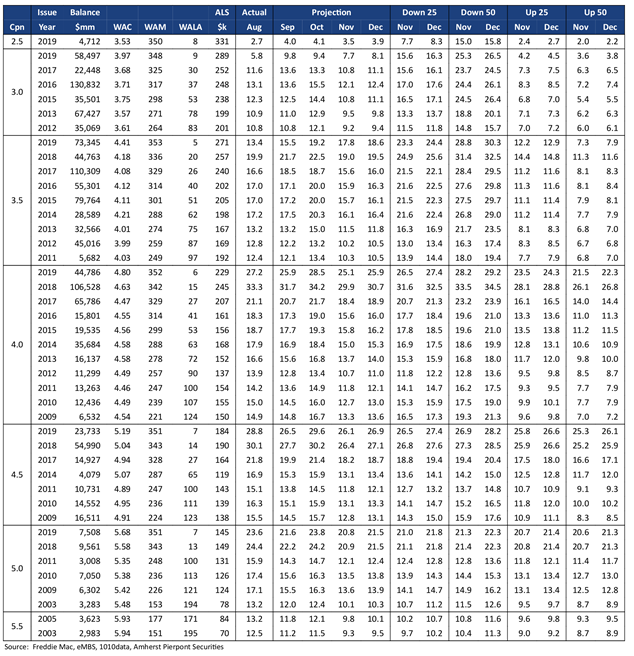
Our short term forecast is shown in Exhibit 7 (Fannie Mae) and Exhibit 8 (Freddie Mac). Exhibit 6 shows the static rates used in the prepayment forecast.
Exhibit 5: Agency speeds, largest cohorts
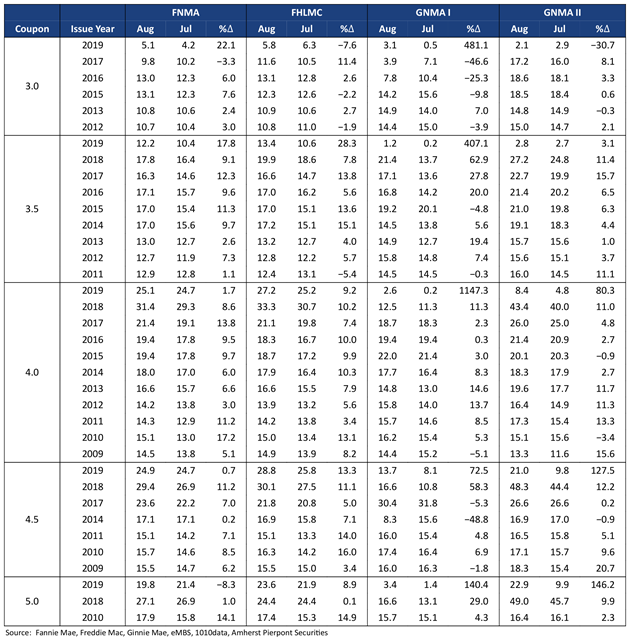
Exhibit 6: Mortgage rate forecast
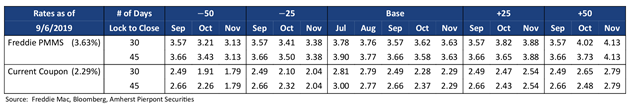
Exhibit 7: Fannie Mae short term forecast
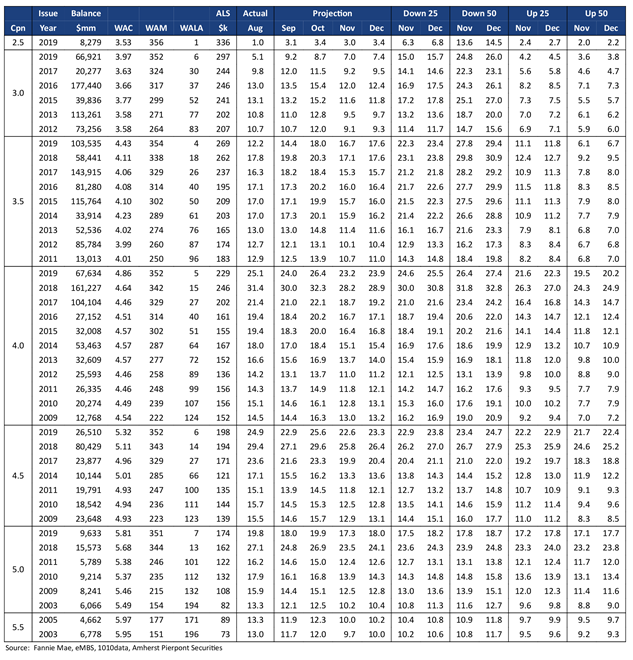
Exhibit 8: Freddie Mac short term forecast
This material is intended only for institutional investors and does not carry all of the independence and disclosure standards of retail debt research reports. In the preparation of this material, the author may have consulted or otherwise discussed the matters referenced herein with one or more of SCM’s trading desks, any of which may have accumulated or otherwise taken a position, long or short, in any of the financial instruments discussed in or related to this material. Further, SCM may act as a market maker or principal dealer and may have proprietary interests that differ or conflict with the recipient hereof, in connection with any financial instrument discussed in or related to this material.
This message, including any attachments or links contained herein, is subject to important disclaimers, conditions, and disclosures regarding Electronic Communications, which you can find at https://portfolio-strategy.apsec.com/sancap-disclaimers-and-disclosures.
Important Disclaimers
Copyright © 2026 Santander US Capital Markets LLC and its affiliates (“SCM”). All rights reserved. SCM is a member of FINRA and SIPC. This material is intended for limited distribution to institutions only and is not publicly available. Any unauthorized use or disclosure is prohibited.
In making this material available, SCM (i) is not providing any advice to the recipient, including, without limitation, any advice as to investment, legal, accounting, tax and financial matters, (ii) is not acting as an advisor or fiduciary in respect of the recipient, (iii) is not making any predictions or projections and (iv) intends that any recipient to which SCM has provided this material is an “institutional investor” (as defined under applicable law and regulation, including FINRA Rule 4512 and that this material will not be disseminated, in whole or part, to any third party by the recipient.
The author of this material is an economist, desk strategist or trader. In the preparation of this material, the author may have consulted or otherwise discussed the matters referenced herein with one or more of SCM’s trading desks, any of which may have accumulated or otherwise taken a position, long or short, in any of the financial instruments discussed in or related to this material. Further, SCM or any of its affiliates may act as a market maker or principal dealer and may have proprietary interests that differ or conflict with the recipient hereof, in connection with any financial instrument discussed in or related to this material.
This material (i) has been prepared for information purposes only and does not constitute a solicitation or an offer to buy or sell any securities, related investments or other financial instruments, (ii) is neither research, a “research report” as commonly understood under the securities laws and regulations promulgated thereunder nor the product of a research department, (iii) or parts thereof may have been obtained from various sources, the reliability of which has not been verified and cannot be guaranteed by SCM, (iv) should not be reproduced or disclosed to any other person, without SCM’s prior consent and (v) is not intended for distribution in any jurisdiction in which its distribution would be prohibited.
In connection with this material, SCM (i) makes no representation or warranties as to the appropriateness or reliance for use in any transaction or as to the permissibility or legality of any financial instrument in any jurisdiction, (ii) believes the information in this material to be reliable, has not independently verified such information and makes no representation, express or implied, with regard to the accuracy or completeness of such information, (iii) accepts no responsibility or liability as to any reliance placed, or investment decision made, on the basis of such information by the recipient and (iv) does not undertake, and disclaims any duty to undertake, to update or to revise the information contained in this material.
Unless otherwise stated, the views, opinions, forecasts, valuations, or estimates contained in this material are those solely of the author, as of the date of publication of this material, and are subject to change without notice. The recipient of this material should make an independent evaluation of this information and make such other investigations as the recipient considers necessary (including obtaining independent financial advice), before transacting in any financial market or instrument discussed in or related to this material.
Important disclaimers for clients in the EU and UK
This publication has been prepared by Trading Desk Strategists within the Sales and Trading functions of Santander US Capital Markets LLC (“SanCap”), the US registered broker-dealer of Santander Corporate & Investment Banking. This communication is distributed in the EEA by Banco Santander S.A., a credit institution registered in Spain and authorised and regulated by the Bank of Spain and the CNMV. Any EEA recipient of this communication that would like to affect any transaction in any security or issuer discussed herein should do so with Banco Santander S.A. or any of its affiliates (together “Santander”). This communication has been distributed in the UK by Banco Santander, S.A.’s London branch, authorised by the Bank of Spain and subject to regulatory oversight on certain matters by the Financial Conduct Authority (FCA) and the Prudential Regulation Authority (PRA).
The publication is intended for exclusive use for Professional Clients and Eligible Counterparties as defined by MiFID II and is not intended for use by retail customers or for any persons or entities in any jurisdictions or country where such distribution or use would be contrary to local law or regulation.
This material is not a product of Santander´s Research Team and does not constitute independent investment research. This is a marketing communication and may contain ¨investment recommendations¨ as defined by the Market Abuse Regulation 596/2014 ("MAR"). This publication has not been prepared in accordance with legal requirements designed to promote the independence of research and is not subject to any prohibition on dealing ahead of the dissemination of investment research. The author, date and time of the production of this publication are as indicated herein.
This publication does not constitute investment advice and may not be relied upon to form an investment decision, nor should it be construed as any offer to sell or issue or invitation to purchase, acquire or subscribe for any instruments referred herein. The publication has been prepared in good faith and based on information Santander considers reliable as of the date of publication, but Santander does not guarantee or represent, express or implied, that such information is accurate or complete. All estimates, forecasts and opinions are current as at the date of this publication and are subject to change without notice. Unless otherwise indicated, Santander does not intend to update this publication. The views and commentary in this publication may not be objective or independent of the interests of the Trading and Sales functions of Santander, who may be active participants in the markets, investments or strategies referred to herein and/or may receive compensation from investment banking and non-investment banking services from entities mentioned herein. Santander may trade as principal, make a market or hold positions in instruments (or related derivatives) and/or hold financial interest in entities discussed herein. Santander may provide market commentary or trading strategies to other clients or engage in transactions which may differ from views expressed herein. Santander may have acted upon the contents of this publication prior to you having received it.
This publication is intended for the exclusive use of the recipient and must not be reproduced, redistributed or transmitted, in whole or in part, without Santander’s consent. The recipient agrees to keep confidential at all times information contained herein.


