Uncategorized
Impact of defeasance on Freddie K-deal spreads
admin | September 13, 2019
This material is a Marketing Communication and does not constitute Independent Investment Research.
Strong property price appreciation in the multifamily sector and low interest rates have contributed to an uptick in defeasance in Freddie K deals – a trend that is likely to continue building over the coming months. An increase in the level of defeasance is one of the primary drivers of spread tightening, and eventually ratings upgrades, on the B and C classes of these deals. The impact of an increase in defeasance on spreads varies based on the percentage of the deal already defeased and the weighted average life of the bond. Such an increase has the largest effect on spreads at very low levels of defeasance.
A rising tide of defeasances and the resulting bond upgrades was highlighted in Ratings transitions in Freddie K deals, published August 9th, 2019. Ratings upgrades have started trickling through, with analysts at Kroll Bond Rating Agency (KBRA) upgrading two Freddie K deals at the end of August (excerpt from CMBS Trend Watch August 2019, page 6):
FREMF 2012-K23
The ratings on Classes B and C were upgraded by one and two notches to AA+ (sf) and A+ (sf), respectively. The upgrades primarily reflect the continued improvement in the pool’s credit performance as well as defeasances. Since KBRA’s last ratings actions in August 2018, 15 loans totaling $166.3 million (13.3%) have fully defeased.
FREMF 2014-K503
The ratings on Classes B and C certificates were upgraded by two and five notches to AAA (sf), respectively. The upgrades reflect the paydown of the underlying trust such that the amount of fully defeased loans is in excess of Classes B and C, the only remaining rated principal classes.
Ratings changes by nature tend to be a lagging indicator of credit performance. Investors respond quickly to new information and spreads incorporate changes in credit metrics soon after data is released. The sheer number of quantitative and qualitative credit metrics that are tracked on a loan by loan basis for commercial real estate can be daunting, but analyzing and projecting performance of Freddie K-deals can be distilled to a handful of factors.
Strong underwriting and calm markets
Freddie K-deals are typically comprised of diversified pools of loans on stabilized multifamily properties which satisfy the agency’s strict, arguably exhaustive, underwriting criteria. Credit performance has been impressive, with zero credit losses on the guaranteed classes and only $15.3 million in total losses realized by B-tranche investors – representing less than 1 basis point of total issuance – in the history of the program. A comprehensive look at the Freddie K program, including performance details, is available in Freddie Mac’s multifamily securitization overview.
The strength of the program, the reasonable liquidity provided by broker dealers, and the relative calm of the multifamily market post-crisis simplifies the performance analysis. Not surprisingly, the level of defeasance in a deal is one of the most significant determinants of spread for Freddie K-deal B and C tranches (Exhibits 1 and 2).
Exhibit 1: B tranche deal spreads vs defeased percentage
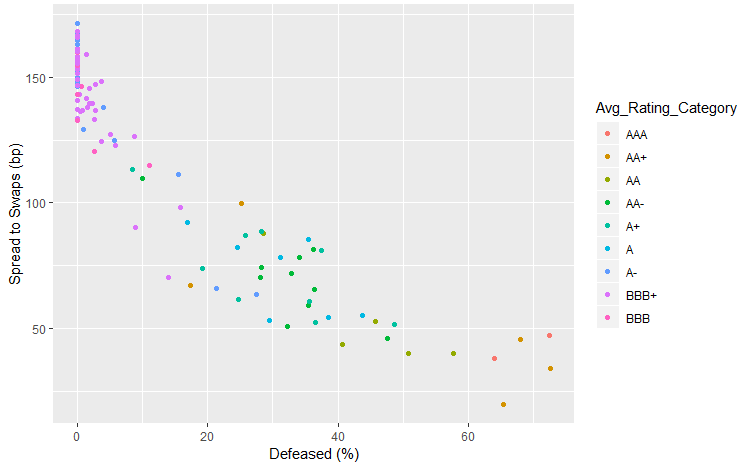
Source: Bloomberg, Amherst Pierpont Securities
The relationship between the spread to swaps of the B or C classes and the level of defeasance in the deal is non-linear, though the non-linearity is much more pronounced in the B piece spreads. Both B and C classes show the greatest compression in spread as defeasance increases from 0% to 15%, with B class spreads tightening on average by 75 bp, while C class spreads tighten by 50 bp. In B classes, which have more credit support at origination than Cs, the rate of spread tightening as defeasance levels rise above 15% slows rather quickly. It requires an increase in defeasance level to 40% for spreads to tighten from 75 bp to 50 bp.
The rate of spread compression for C tranches stays roughly constant as defeasance increases from 15% to 30% and spreads tighten roughly another 50 bp. Above 30% defeasance the spread tightening in C classes slows down markedly, with an increase in defeasance levels from 30% to 60% tightening spreads by about 25 bp from 100 bp to 75 bp.
Exhibit 2: C tranche deal spreads vs defeased percentage
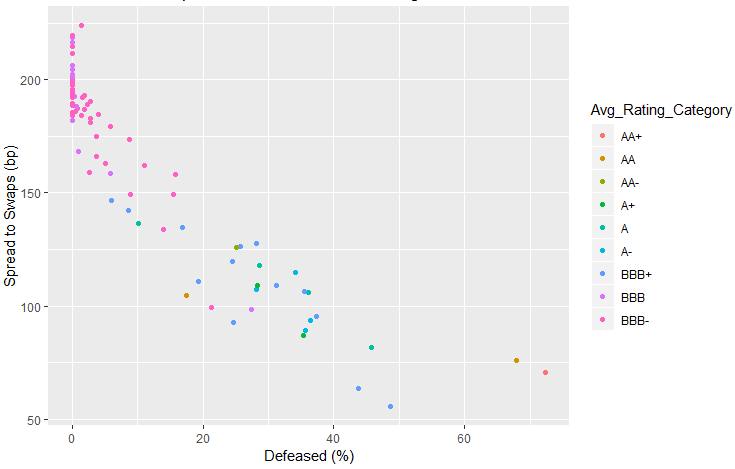
Source: Bloomberg, Amherst Pierpont Securities
The differing dynamic in spread tightening between the Bs and Cs in part reflects the greater credit support of the Bs at origination.
There is also a somewhat wide diversity of ratings across various defeasance buckets. Although much of the spread tightening occurs as defeasance levels and other credit metrics are reported, an upgrade can attract investors who are sensitive to ratings categories due to regulatory or other eligibility criteria.
Monitoring deals for ratings upgrades
A ratings transition matrix for most Freddie K-deal B and C tranches as of September 12, 2019 is available here. Although the link is to a static version, an Excel version is available that automatically downloads data from Bloomberg for investors who would like to keep track of potential and recent ratings actions. Please reach out if you are interested in having a copy.
This material is intended only for institutional investors and does not carry all of the independence and disclosure standards of retail debt research reports. In the preparation of this material, the author may have consulted or otherwise discussed the matters referenced herein with one or more of SCM’s trading desks, any of which may have accumulated or otherwise taken a position, long or short, in any of the financial instruments discussed in or related to this material. Further, SCM may act as a market maker or principal dealer and may have proprietary interests that differ or conflict with the recipient hereof, in connection with any financial instrument discussed in or related to this material.
This message, including any attachments or links contained herein, is subject to important disclaimers, conditions, and disclosures regarding Electronic Communications, which you can find at https://portfolio-strategy.apsec.com/sancap-disclaimers-and-disclosures.
Important Disclaimers
Copyright © 2026 Santander US Capital Markets LLC and its affiliates (“SCM”). All rights reserved. SCM is a member of FINRA and SIPC. This material is intended for limited distribution to institutions only and is not publicly available. Any unauthorized use or disclosure is prohibited.
In making this material available, SCM (i) is not providing any advice to the recipient, including, without limitation, any advice as to investment, legal, accounting, tax and financial matters, (ii) is not acting as an advisor or fiduciary in respect of the recipient, (iii) is not making any predictions or projections and (iv) intends that any recipient to which SCM has provided this material is an “institutional investor” (as defined under applicable law and regulation, including FINRA Rule 4512 and that this material will not be disseminated, in whole or part, to any third party by the recipient.
The author of this material is an economist, desk strategist or trader. In the preparation of this material, the author may have consulted or otherwise discussed the matters referenced herein with one or more of SCM’s trading desks, any of which may have accumulated or otherwise taken a position, long or short, in any of the financial instruments discussed in or related to this material. Further, SCM or any of its affiliates may act as a market maker or principal dealer and may have proprietary interests that differ or conflict with the recipient hereof, in connection with any financial instrument discussed in or related to this material.
This material (i) has been prepared for information purposes only and does not constitute a solicitation or an offer to buy or sell any securities, related investments or other financial instruments, (ii) is neither research, a “research report” as commonly understood under the securities laws and regulations promulgated thereunder nor the product of a research department, (iii) or parts thereof may have been obtained from various sources, the reliability of which has not been verified and cannot be guaranteed by SCM, (iv) should not be reproduced or disclosed to any other person, without SCM’s prior consent and (v) is not intended for distribution in any jurisdiction in which its distribution would be prohibited.
In connection with this material, SCM (i) makes no representation or warranties as to the appropriateness or reliance for use in any transaction or as to the permissibility or legality of any financial instrument in any jurisdiction, (ii) believes the information in this material to be reliable, has not independently verified such information and makes no representation, express or implied, with regard to the accuracy or completeness of such information, (iii) accepts no responsibility or liability as to any reliance placed, or investment decision made, on the basis of such information by the recipient and (iv) does not undertake, and disclaims any duty to undertake, to update or to revise the information contained in this material.
Unless otherwise stated, the views, opinions, forecasts, valuations, or estimates contained in this material are those solely of the author, as of the date of publication of this material, and are subject to change without notice. The recipient of this material should make an independent evaluation of this information and make such other investigations as the recipient considers necessary (including obtaining independent financial advice), before transacting in any financial market or instrument discussed in or related to this material.
Important disclaimers for clients in the EU and UK
This publication has been prepared by Trading Desk Strategists within the Sales and Trading functions of Santander US Capital Markets LLC (“SanCap”), the US registered broker-dealer of Santander Corporate & Investment Banking. This communication is distributed in the EEA by Banco Santander S.A., a credit institution registered in Spain and authorised and regulated by the Bank of Spain and the CNMV. Any EEA recipient of this communication that would like to affect any transaction in any security or issuer discussed herein should do so with Banco Santander S.A. or any of its affiliates (together “Santander”). This communication has been distributed in the UK by Banco Santander, S.A.’s London branch, authorised by the Bank of Spain and subject to regulatory oversight on certain matters by the Financial Conduct Authority (FCA) and the Prudential Regulation Authority (PRA).
The publication is intended for exclusive use for Professional Clients and Eligible Counterparties as defined by MiFID II and is not intended for use by retail customers or for any persons or entities in any jurisdictions or country where such distribution or use would be contrary to local law or regulation.
This material is not a product of Santander´s Research Team and does not constitute independent investment research. This is a marketing communication and may contain ¨investment recommendations¨ as defined by the Market Abuse Regulation 596/2014 ("MAR"). This publication has not been prepared in accordance with legal requirements designed to promote the independence of research and is not subject to any prohibition on dealing ahead of the dissemination of investment research. The author, date and time of the production of this publication are as indicated herein.
This publication does not constitute investment advice and may not be relied upon to form an investment decision, nor should it be construed as any offer to sell or issue or invitation to purchase, acquire or subscribe for any instruments referred herein. The publication has been prepared in good faith and based on information Santander considers reliable as of the date of publication, but Santander does not guarantee or represent, express or implied, that such information is accurate or complete. All estimates, forecasts and opinions are current as at the date of this publication and are subject to change without notice. Unless otherwise indicated, Santander does not intend to update this publication. The views and commentary in this publication may not be objective or independent of the interests of the Trading and Sales functions of Santander, who may be active participants in the markets, investments or strategies referred to herein and/or may receive compensation from investment banking and non-investment banking services from entities mentioned herein. Santander may trade as principal, make a market or hold positions in instruments (or related derivatives) and/or hold financial interest in entities discussed herein. Santander may provide market commentary or trading strategies to other clients or engage in transactions which may differ from views expressed herein. Santander may have acted upon the contents of this publication prior to you having received it.
This publication is intended for the exclusive use of the recipient and must not be reproduced, redistributed or transmitted, in whole or in part, without Santander’s consent. The recipient agrees to keep confidential at all times information contained herein.


