Uncategorized
Are wages and prices accelerating or merely catching up?
admin | September 13, 2019
This material is a Marketing Communication and does not constitute Independent Investment Research.
Patterns this year in average hourly earnings and core CPI are strikingly similar: in both cases, readings in the first several months were softer than the 2018 trend, suggesting a puzzling slowdown. However, both wages and core inflation have picked up noticeably in recent months, bringing the year-to-date averages roughly back in line with 2018 performances. The key question is whether the swing to faster wage and core price increases is simply making up for a downside anomaly in early 2019, or a more persistent heating up of pressures in tight labor and product markets.
Early-2019 average hourly earnings
For years, wage gains had been sluggish. The inevitable result of a tight (and tightening) labor market finally showed through to wages in 2018. The average hourly earnings gauge accelerated from 2.7% on a December-to-December basis in 2017 to 3.3% in 2018. Heading into 2019, there was a widespread expectation that hourly pay would continue to pick up given the tightness of the labor market.
Instead, wage gains slowed up in early 2019. In the first four months of the year, average hourly earnings posted a 2.4% annualized increase, a pace slower than the December-to-December rises in each of the past four years.
Bounceback in average hourly earnings
Since then, average hourly earnings have bounced back vigorously. In fact, the wage series has posted four consecutive monthly advances of 0.3% or more, a first for the measure (the data only go back to 2006). The annualized increase over the past four months (May through August) was 3.9%.
The end result is that the annualized rate of increase on a year-to-date basis is 3.2%, roughly back in line with the 2018 performance (see Exhibit 1).
Exhibit 1: Average hourly earnings
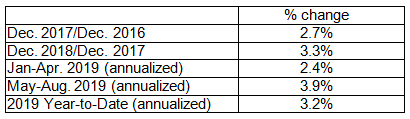
Source: BLS
Early-2019 core CPI
Similarly, after the core PCE deflator finally reached 2% in 2018 after years of missing the Fed’s target, there was a hope that underlying inflation may have turned the corner. Instead, core inflation slid in early 2019. In the case of the core CPI, after a hefty January advance (0.25%), the core CPI rose by only 0.1% for four straight months from February through May. As a result, the year-to-date pace of the core CPI dipped to a 1.8% annualized pace through May.
Bounceback in core CPI
Just when Chairman Powell began to give up hope that underlying inflation would return to target any time soon, the data came roaring back. The core CPI posted back-to-back-to-back 0.3% increases in June, July, and August, the first such streak in almost 25 years. This pushed the three-month annualized rise to 3.4%, also the highest since the mid-1990s. As a result, the year-to-date annualized rise through August for the core CPI has rebounded to 2.4%, higher than any full year since 2007 (see Exhibit 2).
Exhibit 2: Core CPI
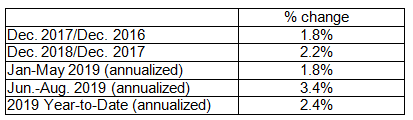
Source: BLS
Where do we go from here?
There are two competing narratives to explain the nearly parallel movements in wages and prices so far this year. The first story would be that the trends have been relatively steady, but there has been a heightened degree of statistical noise, reflecting seasonality or random fluctuations. Under this narrative, the swings should be ignored and we can take comfort in the fact that the year-to-date annualized gains through August are more or less in line with the 2018 results.
Alternatively, it may be that there were fundamental reasons that wages and prices moderated early in the year and a swing in those forces is also responsible for the pickup in subsequent months. For example, it may be that the apparent tightness in the labor market over the past several years was mitigated by people who came off of the sidelines and back into the labor force, limiting the pressure on wages, but that the market has essentially run out of bodies in recent months and, as a result, pay hikes are gathering steam.
I lean toward the first explanation as the main driver of the fluctuations so far this year. For the CPI figures, there is even a detailed story that supports that view. Two key components within the core gauge drove both the weakness early in the year and the subsequent pickup in price hikes: apparel and used vehicles. Apparel prices dropped sharply in March, which, at the time, was attributed to a change in the BLS methodology for collecting readings on apparel costs that was expected to result in a one-off, permanent drop in the level of clothing prices. As it turns out, apparel prices on a seasonally adjusted basis declined in March, April, and May, by almost 3% cumulatively. Apparel prices typically exhibit a high degree of seasonality, and economists would typically have been expecting a rebound after such a large dip, but with the change in methodology, it was unclear how apparel prices would behave going forward. As it turns out, the spring plunge in apparel prices may have been mostly garden-variety noise rather than fallout from the new methodology, as clothing prices have risen for three straight months beginning in June, rebounding by 1.8% cumulatively.
Similarly, used vehicle prices posted declines in four straight months through May and subsequently rebounded noticeably in June, July, and August. Used vehicle prices tend to swing up and down frequently, as the supply of used vehicles on the market tends to fluctuate substantially in a manner that dealers have limited control over (for example, as consumers return lease vehicles or trade in their autos) and the demand for used vehicles also swings around a lot, influenced by, among other things, the aggressiveness of dealer incentives on new vehicles. The CPI component tends to track the data on wholesale vehicle auctions (where most used vehicles are acquired by the dealership that ends up making the sale to a consumer) with roughly a three-month lag, so that both the swoon early in the year and the bounceback this summer were not especially surprising. The wholesale auction data suggest that used vehicle prices should continue to rise heading into the fall, but obviously the almost-15% annualized pace of increase seen over the past three months cannot be sustained for an extended period.
In my view, both wages and core prices should be on a gradually accelerating trend, reflecting the fact that job gains and real GDP growth has largely been faster than the economy’s long-run potential over the past several years, yielding tightness in labor and product markets. However, the magnitude of the swings so far this year have probably been grossly exaggerated by the statistical noise in recent months in both series that I would view as mostly coincidence rather than evidence of a common underlying fundamental shift.
Given the extreme tightness in the labor market and the possible acceleration in productivity growth, a substantial pickup in wages is more plausible to me than a sharp acceleration in core inflation. Having said that, I have been skeptical all along of the sustainability of the dip in core inflation in early 2019, and I do expect even the core PCE deflator, which has been an outlier to the downside among the various gauges of underlying inflation, to return to the 2% range on a year-over-year basis and probably even move above that mark by early 2020, when the low readings discussed above fall out of the 12-month window.
This material is intended only for institutional investors and does not carry all of the independence and disclosure standards of retail debt research reports. In the preparation of this material, the author may have consulted or otherwise discussed the matters referenced herein with one or more of SCM’s trading desks, any of which may have accumulated or otherwise taken a position, long or short, in any of the financial instruments discussed in or related to this material. Further, SCM may act as a market maker or principal dealer and may have proprietary interests that differ or conflict with the recipient hereof, in connection with any financial instrument discussed in or related to this material.
This message, including any attachments or links contained herein, is subject to important disclaimers, conditions, and disclosures regarding Electronic Communications, which you can find at https://portfolio-strategy.apsec.com/sancap-disclaimers-and-disclosures.
Important Disclaimers
Copyright © 2026 Santander US Capital Markets LLC and its affiliates (“SCM”). All rights reserved. SCM is a member of FINRA and SIPC. This material is intended for limited distribution to institutions only and is not publicly available. Any unauthorized use or disclosure is prohibited.
In making this material available, SCM (i) is not providing any advice to the recipient, including, without limitation, any advice as to investment, legal, accounting, tax and financial matters, (ii) is not acting as an advisor or fiduciary in respect of the recipient, (iii) is not making any predictions or projections and (iv) intends that any recipient to which SCM has provided this material is an “institutional investor” (as defined under applicable law and regulation, including FINRA Rule 4512 and that this material will not be disseminated, in whole or part, to any third party by the recipient.
The author of this material is an economist, desk strategist or trader. In the preparation of this material, the author may have consulted or otherwise discussed the matters referenced herein with one or more of SCM’s trading desks, any of which may have accumulated or otherwise taken a position, long or short, in any of the financial instruments discussed in or related to this material. Further, SCM or any of its affiliates may act as a market maker or principal dealer and may have proprietary interests that differ or conflict with the recipient hereof, in connection with any financial instrument discussed in or related to this material.
This material (i) has been prepared for information purposes only and does not constitute a solicitation or an offer to buy or sell any securities, related investments or other financial instruments, (ii) is neither research, a “research report” as commonly understood under the securities laws and regulations promulgated thereunder nor the product of a research department, (iii) or parts thereof may have been obtained from various sources, the reliability of which has not been verified and cannot be guaranteed by SCM, (iv) should not be reproduced or disclosed to any other person, without SCM’s prior consent and (v) is not intended for distribution in any jurisdiction in which its distribution would be prohibited.
In connection with this material, SCM (i) makes no representation or warranties as to the appropriateness or reliance for use in any transaction or as to the permissibility or legality of any financial instrument in any jurisdiction, (ii) believes the information in this material to be reliable, has not independently verified such information and makes no representation, express or implied, with regard to the accuracy or completeness of such information, (iii) accepts no responsibility or liability as to any reliance placed, or investment decision made, on the basis of such information by the recipient and (iv) does not undertake, and disclaims any duty to undertake, to update or to revise the information contained in this material.
Unless otherwise stated, the views, opinions, forecasts, valuations, or estimates contained in this material are those solely of the author, as of the date of publication of this material, and are subject to change without notice. The recipient of this material should make an independent evaluation of this information and make such other investigations as the recipient considers necessary (including obtaining independent financial advice), before transacting in any financial market or instrument discussed in or related to this material.
Important disclaimers for clients in the EU and UK
This publication has been prepared by Trading Desk Strategists within the Sales and Trading functions of Santander US Capital Markets LLC (“SanCap”), the US registered broker-dealer of Santander Corporate & Investment Banking. This communication is distributed in the EEA by Banco Santander S.A., a credit institution registered in Spain and authorised and regulated by the Bank of Spain and the CNMV. Any EEA recipient of this communication that would like to affect any transaction in any security or issuer discussed herein should do so with Banco Santander S.A. or any of its affiliates (together “Santander”). This communication has been distributed in the UK by Banco Santander, S.A.’s London branch, authorised by the Bank of Spain and subject to regulatory oversight on certain matters by the Financial Conduct Authority (FCA) and the Prudential Regulation Authority (PRA).
The publication is intended for exclusive use for Professional Clients and Eligible Counterparties as defined by MiFID II and is not intended for use by retail customers or for any persons or entities in any jurisdictions or country where such distribution or use would be contrary to local law or regulation.
This material is not a product of Santander´s Research Team and does not constitute independent investment research. This is a marketing communication and may contain ¨investment recommendations¨ as defined by the Market Abuse Regulation 596/2014 ("MAR"). This publication has not been prepared in accordance with legal requirements designed to promote the independence of research and is not subject to any prohibition on dealing ahead of the dissemination of investment research. The author, date and time of the production of this publication are as indicated herein.
This publication does not constitute investment advice and may not be relied upon to form an investment decision, nor should it be construed as any offer to sell or issue or invitation to purchase, acquire or subscribe for any instruments referred herein. The publication has been prepared in good faith and based on information Santander considers reliable as of the date of publication, but Santander does not guarantee or represent, express or implied, that such information is accurate or complete. All estimates, forecasts and opinions are current as at the date of this publication and are subject to change without notice. Unless otherwise indicated, Santander does not intend to update this publication. The views and commentary in this publication may not be objective or independent of the interests of the Trading and Sales functions of Santander, who may be active participants in the markets, investments or strategies referred to herein and/or may receive compensation from investment banking and non-investment banking services from entities mentioned herein. Santander may trade as principal, make a market or hold positions in instruments (or related derivatives) and/or hold financial interest in entities discussed herein. Santander may provide market commentary or trading strategies to other clients or engage in transactions which may differ from views expressed herein. Santander may have acted upon the contents of this publication prior to you having received it.
This publication is intended for the exclusive use of the recipient and must not be reproduced, redistributed or transmitted, in whole or in part, without Santander’s consent. The recipient agrees to keep confidential at all times information contained herein.


