


Uncategorized
A new take on liquidity in leveraged loans
admin | September 6, 2019
This document is intended for institutional investors and is not subject to all of the independence and disclosure standards applicable to debt research reports prepared for retail investors. This material does not constitute research.
True liquidity in loans backing CLOs may be harder find than many investors think. The number of market makers in a loan, or its bid depth, and the size of the lending facility often help investors gauge CLO loan liquidity. But leveraged loans with up to seven market makers show clear signs of illiquidity with only higher bid depth trading like truly liquid assets. Loans with facility size up to nearly $2 billion also show signs of illiquidity with only larger facilities looking liquid. Many CLO investors assume loan liquidity rises steadily with bid depth and facility size, but, using a measure first developed to gauge liquidity in other assets, that is not the case.
Extracting liquidity signals from pricing
CLOs have the unique feature of holding loans that also trade in a separate market, and loans pricing contains information about liquidity. In an efficient market, any predictability in asset price or return is an opportunity for arbitrage. If market prices drop but some assets reliably lag, for instance, investors will sell the lagging assets at high prices and reinvest at lower prices. In illiquid markets, transaction costs limit investors’ ability to arbitrage pricing, and pricing will not reflect true market value. Instead, pricing in one period will tend to correlate highly with pricing in another. Analysts (for example, here) have used this persistence in prices or returns, measured as autocorrelation, as a signal of liquidity in assets managed by hedge funds, mutual funds and US equity portfolios. High positive autocorrelation, with positive returns generally followed by more positive returns and negative returns followed by more of the same, becomes a sign of illiquid assets.
Leveraged loans across almost all levels of bid depth and facility size can go for long periods without trading, leaving pricing stale and clouding the potential cost of turning loan into cash. At different levels of bid depth and facility size, autocorrelation in prices may show differences in loan liquidity.
Gauging liquidity across bid depth
This analysis focused first on autocorrelation in different categories of bid depth and used weekly pricing on 2,391 term leveraged loans issued with facility size greater than $250 million during the last three years After calculating the average bid depths of all the loans in the dataset over the 3-year period, the analysis then categorized each loan based on its average bid depth. For each category, the analysis calculated a weekly price series weighting each loan outstanding at the time by its initial facility sizes and then calculated period-to-period returns based on price. Finally, the analysis calculated autocorrelation based on the weighted price series for each bid depth group. If higher bid depth reflects better liquidity, then the autocorrelation of prices should fall as bid depth rises.
The pattern of autocorrelation suggests liquidity improves as bid depth rises, but not in a straight line (Exhibit 1 and Exhibit 2). Autocorrelation for loans in Bid Depth Groups 1 to 3 runs between 0.40 and 0.50 and are highly statistically significant. Groups 4 through 7 slide from 0.37 toward 0.20, still significant. And Group 8 and higher show much lower and statistically insignificant autocorrelation, signals of relatively efficient and liquid markets. These results suggest roughly three categories of liquidity: low liquidity in Bid Depth Groups 1 to 3, medium in Bid Depth Groups 4 to 7, and high in Bid Depth Groups 8 and higher.
Exhibit 1: Autocorrelation in pricing broadly falls as bid depth rises

Source: Markit, Amherst Pierpont Securities; Note: Only U.S. loans with initial facility sizes greater than $250 million and weekly data between October 2016 and August 2019 are included in this analysis.
Exhibit 2: Summary statistics across bid depth groups
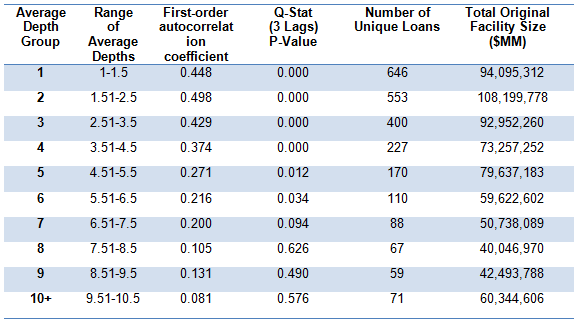
Source: Markit, Amherst Pierpont Securities; Note: Only U.S.leveraged term loans with initial facility sizes greater than $250 million and weekly data between October 2016 and August 2019 are included in this analysis. Statistical analysis used methods outlined in Khandani,Amir E., and Adrew W. Lo (2011), “Illiquidity Premia in Asset Returns: An Empirical Analysis of Hedge Funds, Mutual Funds, and US Equity Portfolios,” Quarterly Journal of Finance. Vol. 1, No. 2, pp. 205-264.
Gauging liquidity across facility size
Another common measure of leveraged loan liquidity is initial facility size. The larger the loan, the thinking goes, the more investors will vie for a share of this loan and contribute to its overall ease of trade. Not surprisingly, facility size tends to rise with bid depth (Exhibit 3). The median facility size in Bid Depth Group 1, for instance, is less than $500 million while the median in Bid Depth Group 10+ is more than $2 billion. However, almost every Bid Depth Group also includes loans with facility size ranging from $250 million to more than $2 billion, so facility size may also help measure liquidity within a Bid Depth Group.
Exhibit 3: Original Facility Size vs Bid Depth Group
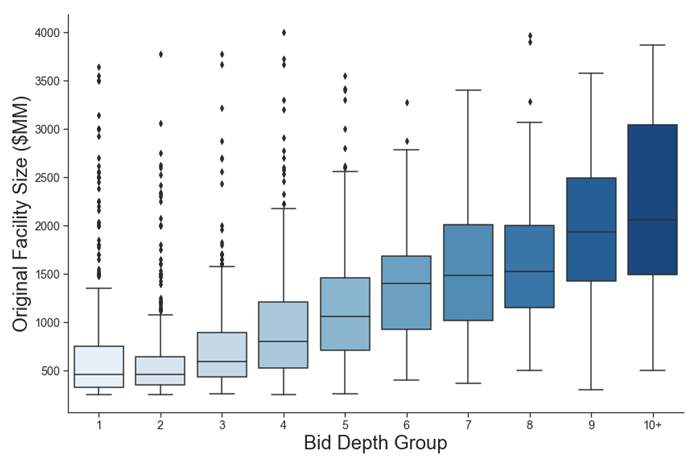
Source: Markit, Amherst Pierpont Securities; Note: Only U.S. loans with initial facility sizes greater than $250 million and weekly data between October 2016 and August 2019 are included in this analysis.
Grouping loans by initial facility size and using the same methodology to calculate a weighted price series and measure autocorrelation, rising facility size also shows signs of improving liquidity (Exhibit 4 and Exhibit 5). Autocorrelation for facility size up to $750 million generally runs between 0.40 and 0.60 and is highly statistically significant. Autocorrelation for facility sizes of $1 billion to $1.5 billion drops into the 0.30s and is also highly significant. And autocorrelation for facilities of $2 billion or greater drops to around 0.10 is not statistically different from zero, signaling a relatively efficient and liquid market. Liquidity again tends to break into high, medium and low.
Exhibit 4: Autocorrelation in price returns drops across facility size
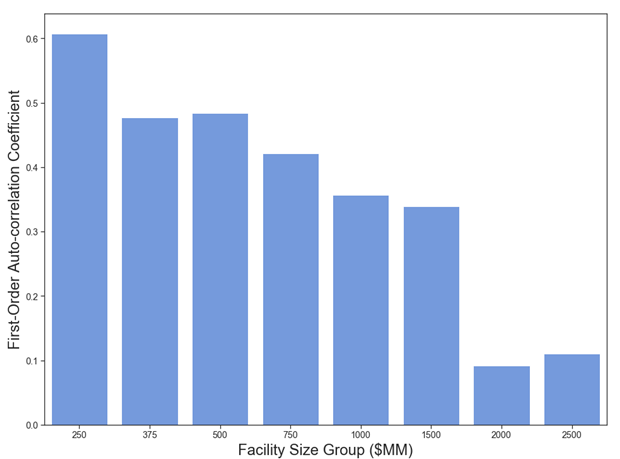
Source: Markit, Amherst Pierpont Securities; Note: Only U.S. loans with initial facility sizes greater than $250 million and weekly data between October 2016 and August 2019 are included in this analysis
Exhibit 5: Return autocorrelation across initial facility-size groups

Source: Markit, Amherst Pierpont Securities; Note: Only U.S.leveraged term loans with initial facility sizes greater than $250 million and weekly data between October 2016 and August 2019 are included in this analysis. Statistical analysis used methods outlined in Khandani,Amir E., and Adrew W. Lo (2011), “Illiquidity Premia in Asset Returns: An Empirical Analysis of Hedge Funds, Mutual Funds, and US Equity Portfolios,” Quarterly Journal of Finance. Vol. 1, No. 2, pp. 205-264.
To hold truly liquid leveraged loans, at least based on the autocorrelation of price returns, CLO managers would have to restrict themselves to only the largest or most broadly traded investment. Since that describes a minority of loans available to most CLO managers, CLO investors realistically will end up holding paper backed by a mix of loans with low or medium liquidity. That implies a material cost to active trading under almost any circumstances and especially if a manager’s view of markets changes substantially and the manager chooses to rebalance. That may make many managers hesitate to either trade into big emerging opportunities or out of big emerging problems.