


Uncategorized
Dissecting CRE property price indices
admin | August 23, 2019
This material is a Marketing Communication and does not constitute Independent Investment Research.
Commercial loan prepayments and defaults are heavily influenced by property price appreciation. But commercial real estate prices, much more than single-family prices, vary significantly across property type and size. That makes tracking CRE prices more complex. Understanding the differences in methodology and property coverage across various CRE price indices is imperative for investors trying to evaluate CRE and CMBS. And since CRE loans are typically subject to prepayment penalties or defeasance requirements that flow through to lenders or CMBS investors, understanding the indices is particularly important.
Broad impact of price appreciation for CRE investors
Tracking CRE property price appreciation is an important fundamental gauge of market strength. Similar to home price appreciation in the single-family residential market, trends in commercial property prices are widely tracked by CRE borrowers, lenders and investors. The amount of available equity can influence an owner’s decision to sell a property, refinance or modify a loan, invest in upgrades or renovations, or default. CRE loans typically have lockout periods and prepayment penalties attached. The penalties can include a declining schedule of fees, often stated as a percentage of the outstanding balance, or provisions for yield maintenance or defeasance. Fees, yield maintenance and defeasance make prepayments in CRE loans even more important.
For investors in CMBS, the allocation of prepayment fees or the pass-through of benefits due to yield maintenance or defeasance can vary by issuer, deal type, or class and tranche structure. For example, in the majority of Ginnie Mae project loan deals all prepayment penalties are allocated to the interest only (IO) class, which can significantly enhance the return for IO investors. Freddie K-deals usually require defeasance of prepaid loans, which enhances the credit quality and can result in ratings upgrades of B and C classes over time.
Tracking prices in a segmented, heterogeneous market
Similar to single-family residential real estate, CRE valuation and price trends can exhibit significant variation based on geographic region and price tier. CRE is additionally segmented by property type – industrial, office, retail and multifamily – where prices may also reflect underlying economic or demographic trends particular to that segment. Two leading providers of CRE composite and segment-based price indices are CoStar and Green Street Advisors. Comparing year-over-year changes in their US indices (Exhibit 1), Green Street indicates CRE prices have broadly increased by 2.40% on average since December 2018, while CoStar data has CRE prices rising at more than twice that pace – by 5.02% on average.
Exhibit 1: CRE composite indices, comparison of recent year-over-year price changes
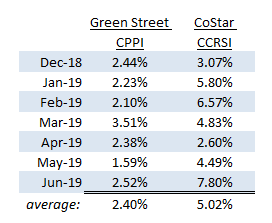
Note: Green Street All Property Core Sector CPPI weights: apartment (25%), industrial (25%), office (25%), and retail (25%). Both indices shown are value-weighted.
The issue is not that one index is right and one is wrong. A confounding issue for anyone attempting to evaluate CRE price trends is that differences in the universe of commercial real estate covered by an index provider, and the methodology chosen for index construction, can lead to significant variance among estimates of price appreciation.
Exhibit 2: CoStar commercial property price indices, equal and value-weighted
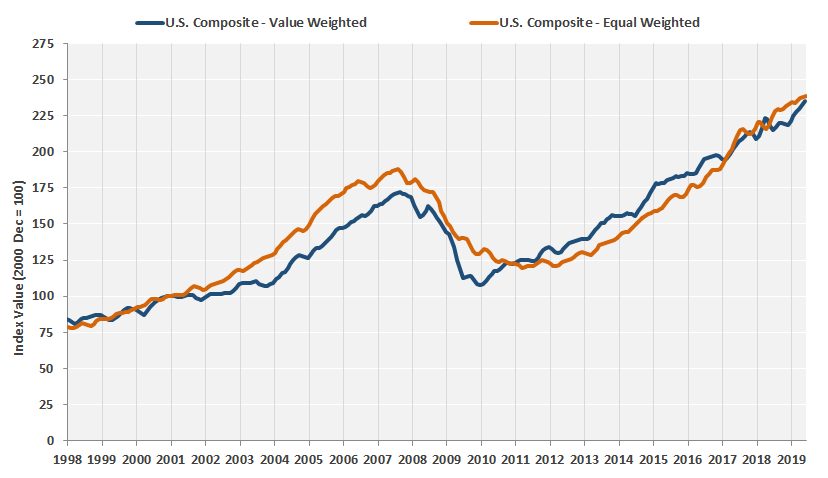
Note: In the equal-weighted index every transaction is treated equally regardless of the value of the transaction. The resulting index is an equal weighted, geometric mean index. The value-weighted index weighs the price change from one sale to the next by the value of each transaction, resulting in a value-weighted, arithmetic mean index. Data through June 2019. Source: CoStar Commercial Repeat-Sale Indices (CCRSI).
Greater dispersion in property prices can lead to biased indices
Composite price indices for U.S. CRE developed by CoStar are shown in Exhibit 2. All CoStar indices are based on repeat sales of the same property without any significant change in building characteristics between sales. This is comparable to the Case-Shiller home price index and the FHFA home price index, both of which are based on repeat sales of the same home.
There are two complicating factors in the CRE market that require discrimination:
- The overall dispersion of property prices is much wider in commercial real estate than in residential. Property prices range from under $1.25 million to $500 million. The distribution of prices also tends to vary by property type.
- The number of transactions for all property types are much higher for lower-priced properties.
Multifamily has the vast number of transactions occur in the under-$2.5 million range, but weighted by market value, the bulk of transaction volume is in $10 million range. The office sector has the greatest number of transactions below $10 million, but by market value the transactions are heavily weighted towards the $10 million to $500 million buckets.
CoStar constructs an equal-weighted and value-weighted version of each index. From their notes on methodology (excerpt page 10, emphasis added):
Generally speaking, the geometric, equal-weighted methodology is more relevant for measuring the performance of individual properties, while the arithmetic, value-weighted index is a better measure of overall market performance. For capturing CRE price movement each method has its pros and cons. Due to the divergence in concentration of transaction activity and value in CRE, a single equal-weighted index is inadequate. In an equal-weighted index every transaction has the same impact on the results regardless of transaction price, which results in a bias towards low-value deals where transaction activity is highest.
The value-weighted index, on the other hand, captures the impact of high-value transactions, which can be relevant to CRE research due to the heavy influence of the high-end properties on overall market value. However, the value-weighted index has the potential to be overly “noisy” since a few very expensive sales will have a disproportionate impact. Therefore, a value-weighted index has limited applicability unless there are sufficient data to mitigate the noise.
Complete index data and notes on CoStar’s methodology can be found on here.
Green Street also constructs a value-weighted index, but their pricing is not based on transactions and the universe of properties they cover is much smaller and focused on institutional-quality CRE.
Green Street’s Commercial Property Price Index is a time series of unleveraged U.S. commercial property values that captures the prices at which commercial real estate transactions are currently being negotiated and contracted. Features that differentiate this index are its timeliness, its emphasis on high-quality properties, and its ability to capture changes in the aggregate value of
the commercial property sector.The index is based on Green Street’s frequently updated estimates of price appreciation of the property portfolios owned by the REITs in its U.S. coverage universe. It is driven by the NAV models maintained by the research team, which, in turn, are driven primarily by changes in market cap rates and NOI growth prospects. Since REITs own high-quality properties, the index measures the value of institutional-quality commercial real estate.
More details on Green Street’s methodology can be found in their press releases, one of which is here. Although its not explicitly stated, since Green Street focuses on high-quality REIT-owned properties, it seems likely that lower priced properties in the $5 million or below price tiers are sparsely represented, if at all, in the Green Street indices.
Differences in price appreciation across property types
The benefit of both CoStar and Green Street indices is that they track price appreciation across the various CRE segments (Exhibit 3 and Exhibit 4). Multifamily CRE price appreciation has outpaced other sectors, benefiting post-crisis from the increase in demand from millenials who so far prefer renting to owning homes. Rent growth in multifamily has also been strong, possibly exacerbated by an ongoing inventory shortage of affordable single family homes. Both trends have contributed to strong price appreciation of multifamily properties.
Exhibit 3: CoStar commercial price indices by property type, equal weighted
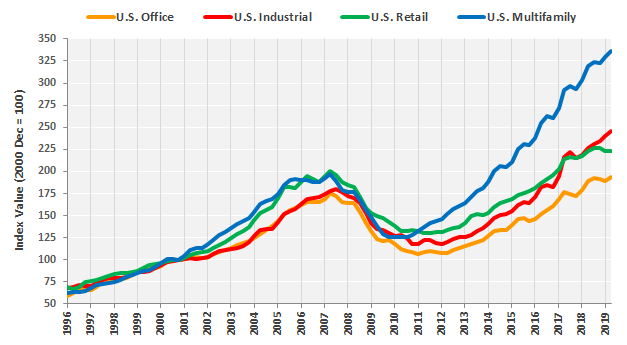
Note: Quarterly data through June 2019. Source: CoStar.
Green Street tracks CRE prices across finer property segments (Exhibit 4). This level of detail can be particularly useful for conduit CMBS investors that want to evaluate CRE price trends in e.g. lodging, self-storage, or student housing specifically, perhaps because a deal has significant exposure to that segment. This data also uncovers the recent price depreciation in shopping malls, and dramatic increase in manufactured homes that could be driving some of the overall increase in the multifamily sector.
Exhibit 4: CRE price indices across segments
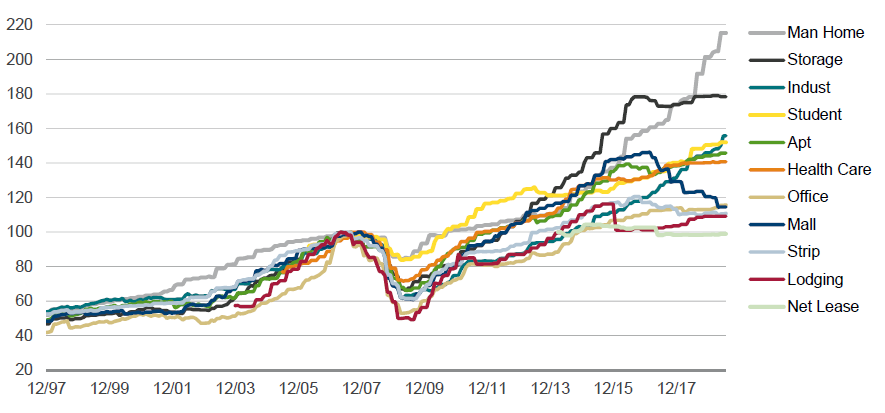
Source: Green Street Advisors
The Federal Reserve tracks commercial real estate prices too
The Federal Reserve began including CoStar’s repeat sales indices to track the value of commercial real estate and multifamily buildings in its “Flow of Funds Accounts of the United States” Z.1 report in June 2012. The Fed incorporated the CoStar data back to 2Q1996, with prior data coming from appraisal based indices produced by National Real Estate Investor (NREI).
From the flow of funds report of the Federal Reserve, data source for commercial real estate prices index:
Starting in 1996q1, the FOF index level is computed by first averaging for each quarter the monthly values of the Costar U.S. Composite Index Excluding Multifamily: Value Weighted, then computing the quarterly change, and then applying the computed change to the previous FOF index series level. Revisions to the Costar Index going back to 1996q2 are incorporated annually. Data for the most recent ten years show no significant seasonality. Prior to 1996q1, the level index is a weighted-average of three appraisal-based commercial property price per square foot series, office property, retail property, and warehouse/industrial property, from NREI.
Arguably the Federal Reserve needs to focus on the broadest measure of US commercial real estate when evaluating the market. Since CoStar covers a larger universe of properties and its data is transaction based, it makes the methodology more consistent with indices for residential real estate that is tracked by the Fed.