Uncategorized
Breaking down the business investment slowdown
admin | August 16, 2019
This material is a Marketing Communication and does not constitute Independent Investment Research.
The financial markets have become increasingly convinced the US economy is heading toward recession, and the inversion of the 2s/10s Treasury yield curve has only intensified the speculation. As Chairman Powell and the FOMC have noted, the main downside risk for the economy is the fallout from the US-China trade dispute, which has dampened global manufacturing. Uncertainty about future global supply chains did slow growth in real business fixed investment in the first half of the year; but a detailed breakdown shows much of the slowdown came in a couple of categories rather than an across-the-board softening.
Structures: oil patch contraction
Real business fixed investment inched lower in the second quarter and increased at only about a 2% annualized pace in the first half of the year. There are three major components within the business fixed investment category of GDP. The first component is structures, which includes nonresidential construction as well as mining activity along with oil and gas drilling. Investment outlays for structures have essentially ground to a halt in the first half of this year after robust growth in 2018 (Exhibit 1).
Exhibit 1: Investment in nonresidential structures
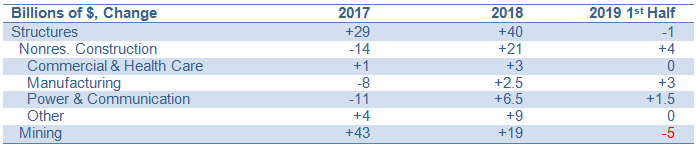
Source: BEA
Closer examination reveals that a good deal of the slowdown in the first half of 2019 came from a drop in the mining category, which turned from robust increases in 2017 and 2018 to a mild decline so far in 2019. This GDP gauge tends to roughly track the domestic rig count, as it measures the construction/operation of wells, not the production of crude oil. Ironically, domestic oil and natural gas production is actually up considerably on a year-over-year basis, but frackers are becoming so much more efficient that they are pumping more oil out of the ground while using fewer wells.
Nonresidential construction has risen, albeit more slowly than in 2018. Keep in mind that the 2019 column for output reflects only two quarters, whereas the 2017 and 2018 columns reflect four. Annualizing the 2019 figures implies that the construction portion of the structures category is on pace to moderate by about $13 billion – from a $21 billion increase in 2018 to a $4 billion rise in the first half of 2019, that, if doubled to reflect a full year’s pace, would be $8 billion. In contrast, the swing in the mining component is worth closer to $30 billion.
Equipment: MAX problems
When most market participants think about business investment, they probably picture outlays on equipment, which is the largest of the three major components of business fixed investment. In real terms, equipment spending was essentially flat in the first half of 2019 after solid gains in 2018. Exhibit 2 lays out results for the equipment component in more detail.
Exhibit 2: Investment in equipment
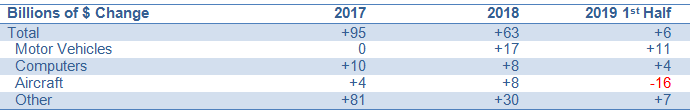
Source: BEA
The vast majority of the slowdown in equipment in outlays in the first half of 2019 is coming from the aircraft industry, an obvious impact of Boeing’s 737 MAX issues. In fact, the aircraft category is down by about one-third since the end of last year. Excluding the aircraft component, equipment outlays rose by $55 billion in the four quarters of 2018 and by $22 billion in the first two quarters of 2019 (which would be $44 billion over a full year), only modestly off of the 2018 pace.
Intellectual property
The third major piece of the business fixed investment is intellectual property, which includes mainly software and R&D outlays. This category has been on a tear since the passage of corporate tax reform and remained robust in early 2019 (Exhibit 3).
Exhibit 3: Investment in intellectual property

Source: BEA
The pace of growth in investment in intellectual property, a $47 billion advance over two quarters, is slightly stronger than the stellar 2018 performance, which notched an $88 billion gain over four quarters.
Summing up
Excluding the two areas of disproportionate weakness, mining and aircraft equipment, business fixed investment rose by $164 billion over the four quarters of 2018, a particularly solid performance. In the first half of 2019, ex-mining and aircraft equipment, business fixed investment outlays advanced by $73 billion, a $146 billion annualized pace, only a modest cooling. One might think that the pace of growth had slowed precipitously, judging from the prevailing commentary.
So, where are we headed? It is fair to surmise that business fixed investment could slow further in the second half of the year, given that trade tensions have ratcheted higher in recent months. Surveys and anecdotal comments indicate that, for the most part, businesses are still quite optimistic regarding the medium-to-long-term outlook. Many are sitting on their hands for a few months, in hopes of gaining clarity regarding the future direction of trade policy, but this is mostly activity deferred rather than activity eliminated.
On the bright side, core capital goods orders and shipments have firmed up, suggesting that the “other” equipment category may strengthen somewhat in the second half of this year, notwithstanding the headwinds from trade uncertainty. Thus, it is not at all clear that the business investment outlook for the second half of the year is necessarily worse than in the first half.
As for our two trouble spots, rig counts continue to decline, so the mining line item may remain soft in the second half of 2019. Meanwhile, the aircraft equipment category will eventually rebound, but delays in getting the 737 MAX recertified appear to be pushing that date back to an early-2020 rather than a late-2019 event. Aircraft shipments may not decline as fast in the second half of the year as they did in the first half, but a full bounceback may be at least a couple of quarters away.
This material is intended only for institutional investors and does not carry all of the independence and disclosure standards of retail debt research reports. In the preparation of this material, the author may have consulted or otherwise discussed the matters referenced herein with one or more of SCM’s trading desks, any of which may have accumulated or otherwise taken a position, long or short, in any of the financial instruments discussed in or related to this material. Further, SCM may act as a market maker or principal dealer and may have proprietary interests that differ or conflict with the recipient hereof, in connection with any financial instrument discussed in or related to this material.
This message, including any attachments or links contained herein, is subject to important disclaimers, conditions, and disclosures regarding Electronic Communications, which you can find at https://portfolio-strategy.apsec.com/sancap-disclaimers-and-disclosures.
Important Disclaimers
Copyright © 2026 Santander US Capital Markets LLC and its affiliates (“SCM”). All rights reserved. SCM is a member of FINRA and SIPC. This material is intended for limited distribution to institutions only and is not publicly available. Any unauthorized use or disclosure is prohibited.
In making this material available, SCM (i) is not providing any advice to the recipient, including, without limitation, any advice as to investment, legal, accounting, tax and financial matters, (ii) is not acting as an advisor or fiduciary in respect of the recipient, (iii) is not making any predictions or projections and (iv) intends that any recipient to which SCM has provided this material is an “institutional investor” (as defined under applicable law and regulation, including FINRA Rule 4512 and that this material will not be disseminated, in whole or part, to any third party by the recipient.
The author of this material is an economist, desk strategist or trader. In the preparation of this material, the author may have consulted or otherwise discussed the matters referenced herein with one or more of SCM’s trading desks, any of which may have accumulated or otherwise taken a position, long or short, in any of the financial instruments discussed in or related to this material. Further, SCM or any of its affiliates may act as a market maker or principal dealer and may have proprietary interests that differ or conflict with the recipient hereof, in connection with any financial instrument discussed in or related to this material.
This material (i) has been prepared for information purposes only and does not constitute a solicitation or an offer to buy or sell any securities, related investments or other financial instruments, (ii) is neither research, a “research report” as commonly understood under the securities laws and regulations promulgated thereunder nor the product of a research department, (iii) or parts thereof may have been obtained from various sources, the reliability of which has not been verified and cannot be guaranteed by SCM, (iv) should not be reproduced or disclosed to any other person, without SCM’s prior consent and (v) is not intended for distribution in any jurisdiction in which its distribution would be prohibited.
In connection with this material, SCM (i) makes no representation or warranties as to the appropriateness or reliance for use in any transaction or as to the permissibility or legality of any financial instrument in any jurisdiction, (ii) believes the information in this material to be reliable, has not independently verified such information and makes no representation, express or implied, with regard to the accuracy or completeness of such information, (iii) accepts no responsibility or liability as to any reliance placed, or investment decision made, on the basis of such information by the recipient and (iv) does not undertake, and disclaims any duty to undertake, to update or to revise the information contained in this material.
Unless otherwise stated, the views, opinions, forecasts, valuations, or estimates contained in this material are those solely of the author, as of the date of publication of this material, and are subject to change without notice. The recipient of this material should make an independent evaluation of this information and make such other investigations as the recipient considers necessary (including obtaining independent financial advice), before transacting in any financial market or instrument discussed in or related to this material.
Important disclaimers for clients in the EU and UK
This publication has been prepared by Trading Desk Strategists within the Sales and Trading functions of Santander US Capital Markets LLC (“SanCap”), the US registered broker-dealer of Santander Corporate & Investment Banking. This communication is distributed in the EEA by Banco Santander S.A., a credit institution registered in Spain and authorised and regulated by the Bank of Spain and the CNMV. Any EEA recipient of this communication that would like to affect any transaction in any security or issuer discussed herein should do so with Banco Santander S.A. or any of its affiliates (together “Santander”). This communication has been distributed in the UK by Banco Santander, S.A.’s London branch, authorised by the Bank of Spain and subject to regulatory oversight on certain matters by the Financial Conduct Authority (FCA) and the Prudential Regulation Authority (PRA).
The publication is intended for exclusive use for Professional Clients and Eligible Counterparties as defined by MiFID II and is not intended for use by retail customers or for any persons or entities in any jurisdictions or country where such distribution or use would be contrary to local law or regulation.
This material is not a product of Santander´s Research Team and does not constitute independent investment research. This is a marketing communication and may contain ¨investment recommendations¨ as defined by the Market Abuse Regulation 596/2014 ("MAR"). This publication has not been prepared in accordance with legal requirements designed to promote the independence of research and is not subject to any prohibition on dealing ahead of the dissemination of investment research. The author, date and time of the production of this publication are as indicated herein.
This publication does not constitute investment advice and may not be relied upon to form an investment decision, nor should it be construed as any offer to sell or issue or invitation to purchase, acquire or subscribe for any instruments referred herein. The publication has been prepared in good faith and based on information Santander considers reliable as of the date of publication, but Santander does not guarantee or represent, express or implied, that such information is accurate or complete. All estimates, forecasts and opinions are current as at the date of this publication and are subject to change without notice. Unless otherwise indicated, Santander does not intend to update this publication. The views and commentary in this publication may not be objective or independent of the interests of the Trading and Sales functions of Santander, who may be active participants in the markets, investments or strategies referred to herein and/or may receive compensation from investment banking and non-investment banking services from entities mentioned herein. Santander may trade as principal, make a market or hold positions in instruments (or related derivatives) and/or hold financial interest in entities discussed herein. Santander may provide market commentary or trading strategies to other clients or engage in transactions which may differ from views expressed herein. Santander may have acted upon the contents of this publication prior to you having received it.
This publication is intended for the exclusive use of the recipient and must not be reproduced, redistributed or transmitted, in whole or in part, without Santander’s consent. The recipient agrees to keep confidential at all times information contained herein.


