


Uncategorized
Understanding HECM refinancing
admin | August 2, 2019
This material is a Marketing Communication and does not constitute Independent Investment Research.
Home equity conversion mortgages or HECMs are the reverse mortgage product offered by the FHA, securitized by Ginnie Mae and backed by the full faith and credit of the US government. Homeowners use reverse mortgages to draw on their home equity. For investors, an important facet of the product is that interest rates do not have a large influence on prepayment speeds. The loans consequently can have better convexity than even highly call-protected 30-year MBS pools.
Better financing does not drive the refinance decision
HECM loans can be floating-rate, resetting monthly or annually, or fixed-rate. The floating-rate products do not have an initial fixed-rate period, and therefore if interest rates drop, borrowers can wait for the loan to reset lower. There is no need to pay expensive origination fees to refinance into a lower rate. Almost 90% of HECM pools issued since the beginning of 2018 are floating-rate pools.
The fixed-rate HECM borrowers, in theory, should refinance if interest rates fall. However, the rates offered to these borrowers have been very stable throughout the life of the program and show little correlation to other interest rates.
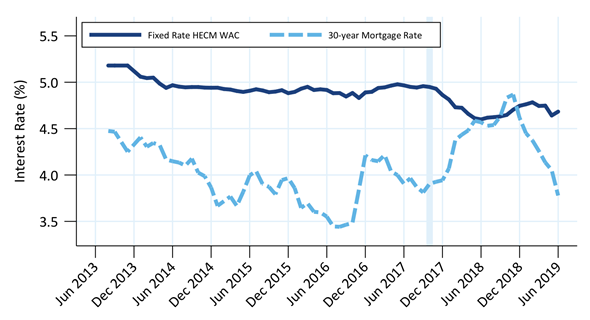
Exhibit 1 plots the HECM production rate and Freddie Mac’s 30-year primary mortgage market survey rate over time. From 2013 through 2017, the 30-year rate moved 100 bp from peak to trough yet the HECM rate hovered around 5.0%. One reason for this is that the initial amount the borrower can draw on the loan, known as the initial principal limit, did not increase if rates fell below 5.0%, so many lenders wouldn’t originate loans below that level.
In October 2017, the FHA adjusted the program such that the largest initial loan amount was reached at a 3.0% interest rate, and declined as rates increased from there (note that the loan size at 3.0% after October 2017 was generally the same as the loan size at 5.0% before October 2017, so most borrowers saw initial principal limit decline). The production rate subsequently fell closer to 4.5%.
Exhibit 1: HECM interest rates do not move with other mortgage rates
Source: Ginnie Mae, eMBS, Amherst Pierpont Securities
Because of the limited range of interest rates historically available to HECM fixed rate borrowers, it is very difficult to isolate rate-driven refinancing in the data.
HECM borrowers do refinance—if they can get a larger loan
The primary factor that drives the refinance decision is whether the borrower can get a larger loan. When a HECM is originated the maximum loan amount is set to the lesser of the appraisal value or the HECM program loan limit. The initial principal limit is set much lower and the loan accrues over time to the maximum amount. This principal limit factor, or PLF, depends on the borrower’s age and the interest rate on the loan. A younger borrower is projected to live longer and accrue for longer, so is given a lower PLF. A lower expected interest rate means a slower expected accrual, so the borrower is given a higher PLF. The “PLF tables” contain the PLF for every combination of interest rate and borrower age.
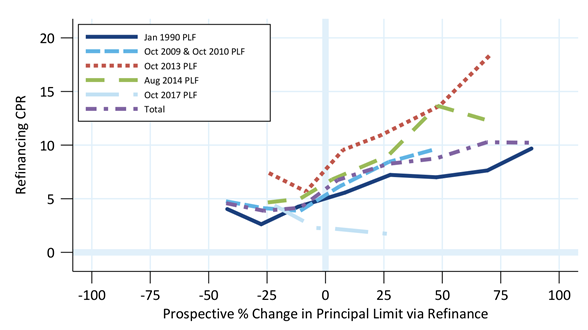
HECM borrowers are more likely to refinance if the new loan offers greater borrowing capacity than the existing loan (Exhibit 2). HECM prepayments are grouped into cohorts based on the PLF tables under which the loan was originated. This is comparable to grouping by vintage in typical MBS prepayment analysis.
The PLF tables have changed a few times, and the most recent changes, from 2013 until today, have been aimed at improving the solvency of the HECM insurance fund. Performance was measured from mid-2013, when Ginnie Mae began releasing loan-level data, until June 2019.
Exhibit 2: HECM borrowers refinance to access more cash
Source: Ginnie Mae, eMBS, Amherst Pierpont Securities
For each loan, an estimate is made of the borrowing capacity of the new loan. This depends on estimated home price appreciation using Case-Shiller’s home price index, current interest rates, the current age of the younger borrower on the loan, and the PLF tables in force at the time. The x-axis is the percentage increase or decrease relative to the current loan amount. The y-axis is the prepayment rate due to refinancing; Ginnie Mae discloses a variety of payoff reasons for HECMs, which makes it possible to differentiate refinances from other prepayments.
There is some variation by cohort, with the October 2013 and October 2014 PLF cohorts prepaying the fastest. The industry chooses not to refinance borrowers until the loan is at least 18 months seasoned, which is why the October 2017 PLF cohort is extremely slow (most loans are younger than that). But even the fastest S-curve is quite flat, not even reaching 20 CPR.
Rates should have a small effect on prepayment speeds
If interest rates fall the PLF increases, so a drop in interest rates should push speeds faster since the new loan would let the borrower access more cash today. So it is possible to calculate a traditional S-curve by mapping the change in interest rate into the percent change in PLF and looking up the prepayment speed implied by the previous S-curve. Doing this for a variety of rates generates a rate-based S-curve.
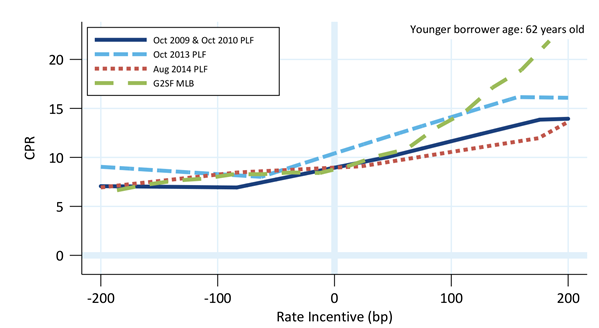
For example, consider a 62-year-old borrower that just originated a HECM linked to a 5.0% expected accrual rate. The initial PLF is 0.410. If rates suddenly rallied to 3.0% then the PLF would increase to 0.524, a 28% increase. If the borrower were able to refinance this suggests refinance speeds might increase roughly 5.0 CPR, which is not a large move for such a large drop in interest rates. The full S-curve for this borrower, which uses total prepayment speeds, is shown in Exhibit 3.
Exhibit 3: HECM prepayments vs rate for 62 year old borrowers
Source: Ginnie Mae, eMBS, Amherst Pierpont Securities
The S-curves for three different PLF cohorts are shown to give an idea where somewhat faster and slower HECM collateral might prepay. The rate sensitivity is based on the 2017 PLF tables. For comparison the S-curve for 30-year Ginnie Mae MLB MBS is shown. Speeds are similar for the first 100 basis point rate rally, but the MLBs prepay much faster as rates fall further. Another point is that the HECM S-curve is capped, since the PLF doesn’t increase if rates fall below 3.0%. Lower rate loans would reach the cap sooner than higher rate loans, so have more protection against rate rallies. In theory a loan with a 3.0% interest rate would have a one-sided exposure to interest rate moves—if rates rallied lower speeds would remain the same, while if rates increase prepayment speeds would decline.
Rate incentive is measured differently for HECMs and 30-year MBS. The PLF determination for floating rate HECMs is tied to either the 10-year Treasury rate or 10-year swap rate, while the 30-year MBS rate incentive is compared to Freddie Mac’s primary mortgage survey rate. So there is basis exposure when comparing S-curves for the two products, but the HECM S-curves are so flat that any effect is likely to be very small in practice.
HECM S-curves flatten as a borrower ages
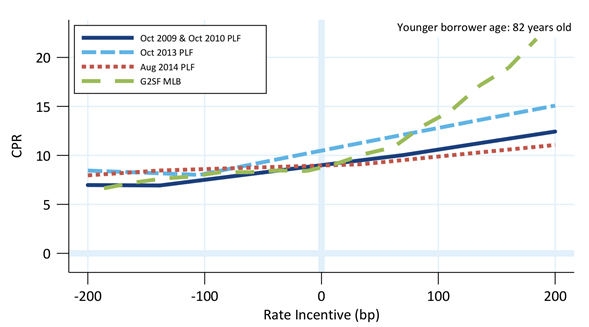
Another facet of the PLF tables is that the PLF varies less with interest rate for older borrowers. So as a borrower ages they naturally become less sensitive to interest rates and the S-curve flattens. Consider the prior example but with an 82-year old borrower. The PLFs are 0.658 at 3.0% and 0.556 at 5.0%, so the same 200 basis point rally only increases the principal limit by roughly 18%. The flatter S-curve for this borrower is shown in Exhibit 4.
Exhibit 4: HECM prepayments vs rate for 82 year old borrowers
Source: Ginnie Mae, eMBS, Amherst Pierpont Securities
A loan to an 82 year old borrower that prepays similarly to the October 2013 PLF cohort and had 200 basis points rate incentive would only prepay at 15 CPR, while a 62 year old borrower might prepay at 16 to 17 CPR. Both are well below expected speeds on a 30-year MLB pool with the same rate incentive.
Conclusion
The HECM product presents interesting opportunities for MBS investors. This collateral offers convexity that rivals or exceeds the best call protected collateral in 30-year MBS, and is backed by the full faith and credit of the United States government.