Uncategorized

Banks become negative on negative convexity

| August 1, 2019

This document is intended for institutional investors and is not subject to all of the independence and disclosure standards applicable to debt research reports prepared for retail investors. This material does not constitute research.

The shift towards an easier stance of monetary policy has ushered in lower rates, which inevitably leads to a pick-up in refinance activity. Anecdotally, some banks have recently started to partially mitigate the negative convexity risk by underweighting agency pass-throughs and CMOs in favor of overweighting longer duration, positively convex agency CMBS. The migration has coincided with moderately tightened spreads, particularly in the larger and well diversified Freddie Mac K deals, but the paper still looks competitive versus equivalently rated corporates and benefits from better liquidity.

The only good refi is your own

A recent uptick in bank buying of agency CMBS is likely a defensive move in response to a pick-up in refinances that has already started to emerge in agency prepay reports. Freddie K-deal fixed rate classes are commercial mortgage pass-throughs which are locked out from prepayments for most of the life of the security, so they effectively perform like fixed rate bullets and exhibit positive convexity. Since late June spreads on the fixed-rate A classes have tightened by several basis points across the maturity spectrum (Exhibit 1).

Exhibit 1: Freddie K-deal spreads have recently tightened

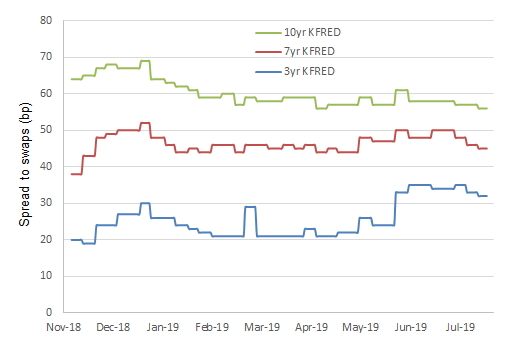
Source: Amherst Pierpont Securities

Competitive spreads, better liquidity than similarly rated corporates

Banks, insurance companies and other investors that need AAA to AA rated bonds without the negative convexity don’t have a lot of options, particularly in the longer end of the curve (Exhibit 2). There are two AAA rated corporate issuers – Microsoft and Johnson & Johnson – with $10.5 billion of paper currently outstanding in the 7-10 year part of the curve. In the AA+ to AA- category there are 12 issuers with $25.3 billion outstanding, though several of the names have only a single bond outstanding in the sector.

Exhibit 2: Highly rated US investment grade corporates (7-10 year sector)

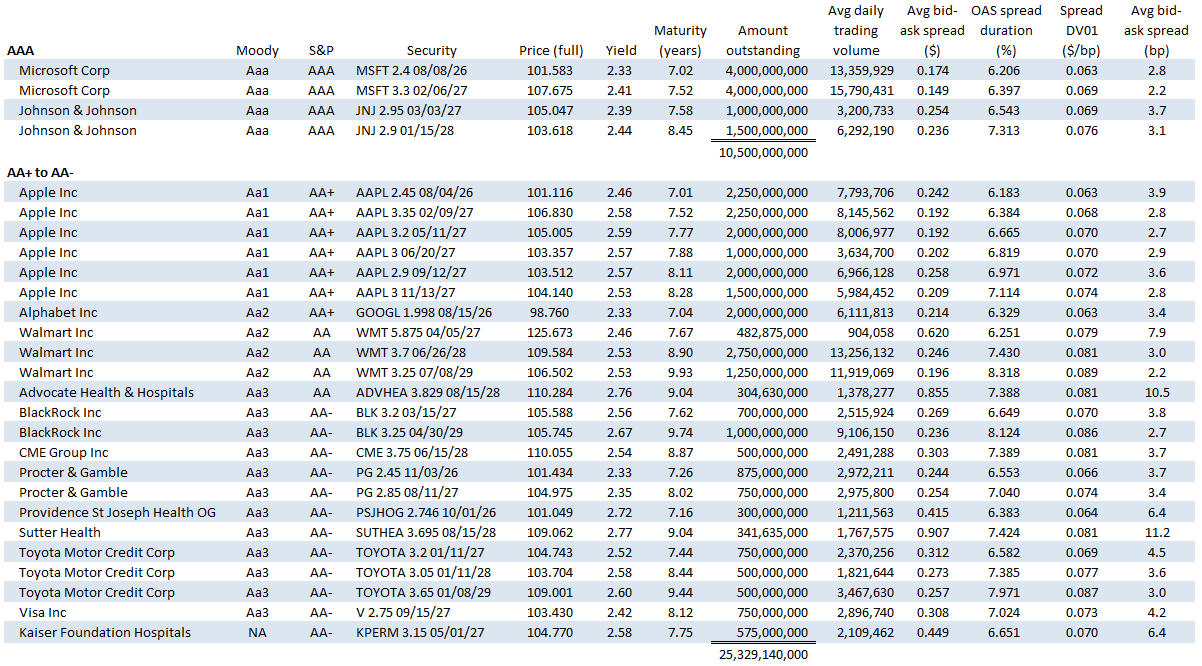
Note: Average daily trading volume and average bid-ask spread in dollars are estimated by Bloomberg using TRACE data and BMRK pricing and algorithms in their liquidity analysis. Prices from Bloomberg BMRK as of 7/31/2019. Includes senior unsecured AAA to AA- rated corporate issues with at least $300 million outstanding.Does not include supra sovereigns or foreign development banks. Source: Bloomberg, Amherst Pierpont Securities. 

Liquidity in corporate bonds suffers both as size decreases (Exhibit 3) and the issue ages. A good example of this is seen in the WMT 5.875 4/5/27, which has below $500 million outstanding, was originally issued as a 20-year bond and has less than 7 years left to maturity. The liquidity of the bond is quite low, with an average daily trading volume below $1 million notional and a bid-ask spread of 7.9 bp. Not surprising that few investors want to part with a highly rated, high coupon, decade off-the-run bond in this environment, but it is symptomatic of the liquidity challenges in the highest grade corporate sector generally. Of the 27 issues shown, all but one of them was originally issued as a 10-year security, and only two of them were issued within the last six months.

Exhibit 3: Bid-ask spreads widens as issue size decreases

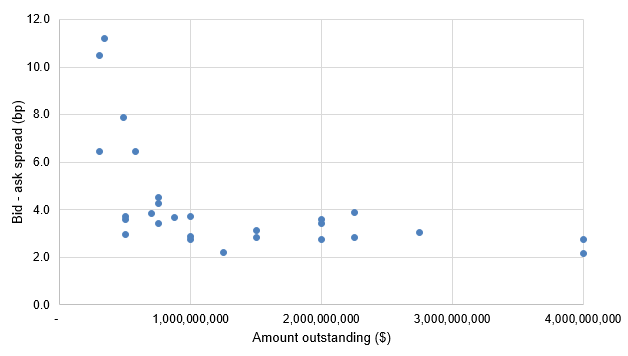
Note: Average bid-ask spread in basis points calculated from bid-ask spread in dollars, prices and OAS spread duration from Bloomberg.Source: Bloomberg, Amherst Pierpont Securities.

The fixed-rate, reliably AAA-rated at issuance piece of a Freddie K deal is the A2 class. A group of standard deal, multifamily pass-through A2s with weighted average life between 7- to 10-years is shown in Exhibit 4. There is $34.6 billion of this AAA-rated paper outstanding across 35 deals, with an average number of 64 multifamily loans underlying each security and 19% credit enhancement on average. Yields range from 2.30% to 2.48%, which is competitive to slightly higher than those available in investment grade corporate AAA paper in the same sector. Freddie K-deals have grown in size and frequency of issuance over the last several years, with typically at least one to two deals printing each month.

Exhibit 4: Freddie K-deal A2s outstanding, (7- to 10-year sector, list not exhaustive)

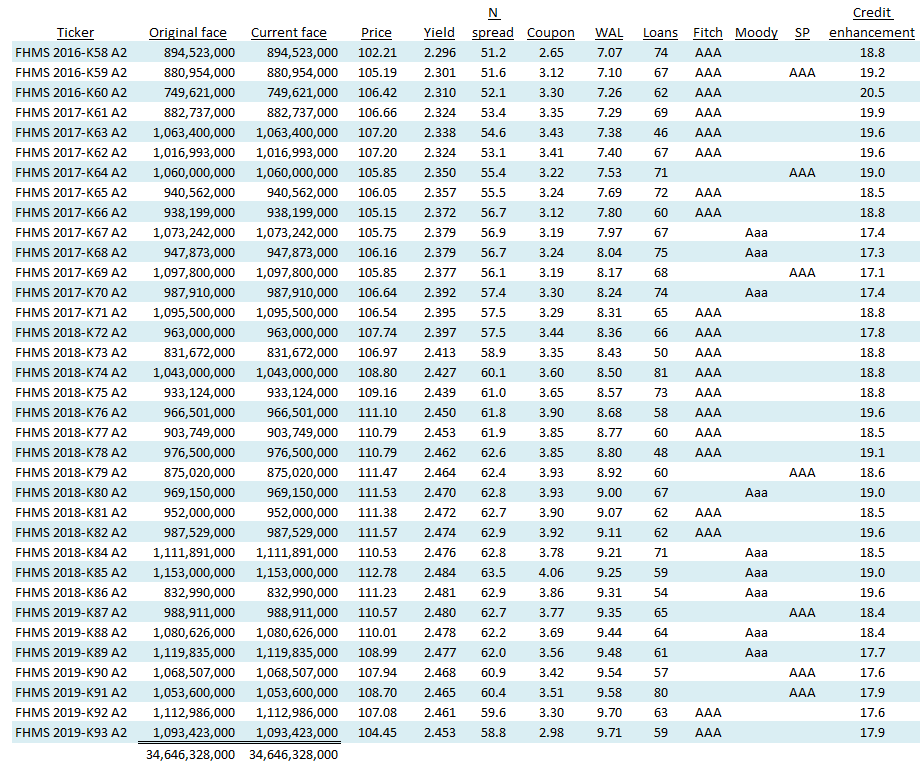
Note: All prices and spreads from Bloomberg as of 7/31/2019. Source: Bloomberg, Amherst Insight Labs, Amherst Pierpont Securities.

Freddie K investors can pick up yield by going down in credit to the AM class, which is typically rated Aa3/AA- to A1/A+ on the underlying collateral (Exhibit 5). Fitch and Moody’s rate these classes AAA because, like all of the A classes, they are wrapped with the Freddie Mac guarantee for timely payment of interest and ultimate payment of principal. Other ratings agencies incorporate the lower credit enhancement of the AMs compared to the A2s, as well as a variety of other metrics of the underlying collateral and structure into their ratings, before the bond is wrapped with the guarantee.

There is also a few basis points of extra yield available in the smaller Freddie K programs, such as the K-W deals which securitize workforce housing. The issuance is less frequent and the deal sizes are somewhat smaller, but the A classes are also wrapped with Freddie’s guarantee.

Exhibit 5: Freddie K-deal AMs outstanding (7- to 10-year sector, list not exhaustive)

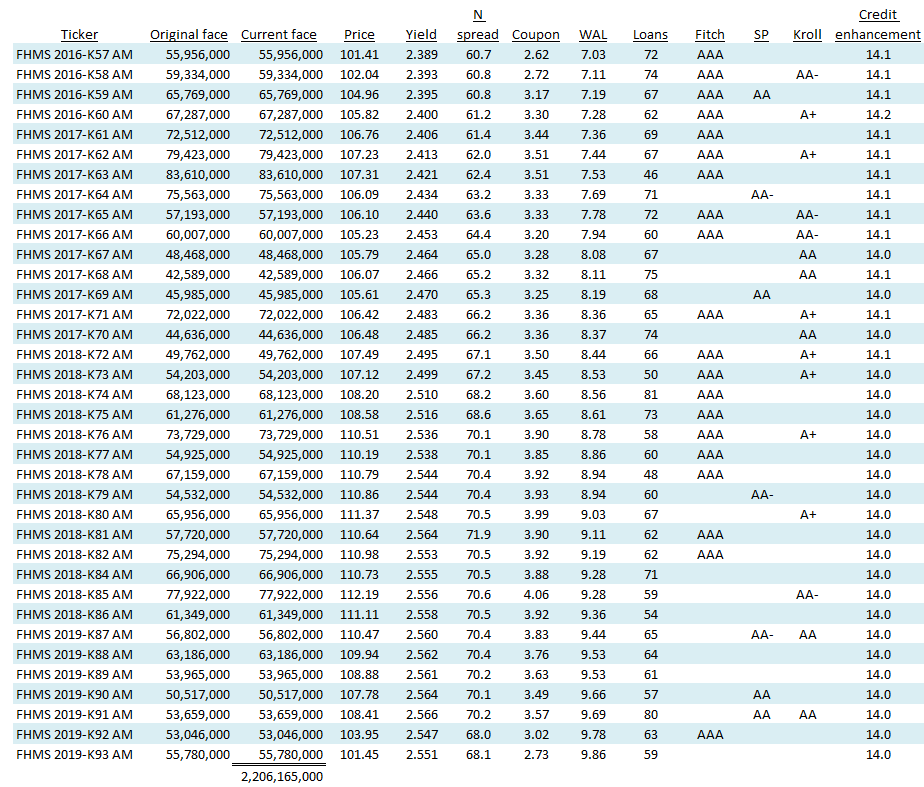
The AMs currently yield from 2.39% to 2.56%, also competitive with the AA+ to AA- corporates in the same sector. The AM class tends to be much smaller than the A2, with only $2.2 billion total outstanding of the deals shown, and averaging $60 million face per deal.

FINRA does not provide a detailed breakdown of pricing or trading activity for structured products, though there is some aggregated data available on their website here. Trading volume in investment grade agency CMBS on 7/31/2019 was $440 million in market value across 100 trades and 44 unique securities. The breakdown by maturity sector, deal type and issuer is obviously unknown, but Freddie K deals are the deepest, most liquid market segment in agency CMBS. For comparison, the total estimated daily trading volume across all of the AAA to AA- corporate bonds shown in Exhibit 2 is $148 million.

The other benefit in agency CMBS is the greater liquidity provided by the dealer community in support of the programs. Freddie K A2 and AM paper tends trade in a 1 to 2 bp bid-ask market on spread, keeping the cost of trading paper relatively low even for the smaller sized AM deals and any seasoned paper.

admin
jkillian@apsec.com
john.killian@santander.us 1 (646) 776-7714

This material is intended only for institutional investors and does not carry all of the independence and disclosure standards of retail debt research reports. In the preparation of this material, the author may have consulted or otherwise discussed the matters referenced herein with one or more of SCM’s trading desks, any of which may have accumulated or otherwise taken a position, long or short, in any of the financial instruments discussed in or related to this material. Further, SCM may act as a market maker or principal dealer and may have proprietary interests that differ or conflict with the recipient hereof, in connection with any financial instrument discussed in or related to this material.

This message, including any attachments or links contained herein, is subject to important disclaimers, conditions, and disclosures regarding Electronic Communications, which you can find at https://portfolio-strategy.apsec.com/sancap-disclaimers-and-disclosures.

Important Disclaimers

Copyright © 2025 Santander US Capital Markets LLC and its affiliates (“SCM”). All rights reserved. SCM is a member of FINRA and SIPC. This material is intended for limited distribution to institutions only and is not publicly available. Any unauthorized use or disclosure is prohibited.

In making this material available, SCM (i) is not providing any advice to the recipient, including, without limitation, any advice as to investment, legal, accounting, tax and financial matters, (ii) is not acting as an advisor or fiduciary in respect of the recipient, (iii) is not making any predictions or projections and (iv) intends that any recipient to which SCM has provided this material is an “institutional investor” (as defined under applicable law and regulation, including FINRA Rule 4512 and that this material will not be disseminated, in whole or part, to any third party by the recipient.

The author of this material is an economist, desk strategist or trader. In the preparation of this material, the author may have consulted or otherwise discussed the matters referenced herein with one or more of SCM’s trading desks, any of which may have accumulated or otherwise taken a position, long or short, in any of the financial instruments discussed in or related to this material. Further, SCM or any of its affiliates may act as a market maker or principal dealer and may have proprietary interests that differ or conflict with the recipient hereof, in connection with any financial instrument discussed in or related to this material.

This material (i) has been prepared for information purposes only and does not constitute a solicitation or an offer to buy or sell any securities, related investments or other financial instruments, (ii) is neither research, a “research report” as commonly understood under the securities laws and regulations promulgated thereunder nor the product of a research department, (iii) or parts thereof may have been obtained from various sources, the reliability of which has not been verified and cannot be guaranteed by SCM, (iv) should not be reproduced or disclosed to any other person, without SCM’s prior consent and (v) is not intended for distribution in any jurisdiction in which its distribution would be prohibited.

In connection with this material, SCM (i) makes no representation or warranties as to the appropriateness or reliance for use in any transaction or as to the permissibility or legality of any financial instrument in any jurisdiction, (ii) believes the information in this material to be reliable, has not independently verified such information and makes no representation, express or implied, with regard to the accuracy or completeness of such information, (iii) accepts no responsibility or liability as to any reliance placed, or investment decision made, on the basis of such information by the recipient and (iv) does not undertake, and disclaims any duty to undertake, to update or to revise the information contained in this material.

Unless otherwise stated, the views, opinions, forecasts, valuations, or estimates contained in this material are those solely of the author, as of the date of publication of this material, and are subject to change without notice. The recipient of this material should make an independent evaluation of this information and make such other investigations as the recipient considers necessary (including obtaining independent financial advice), before transacting in any financial market or instrument discussed in or related to this material.

Important disclaimers for clients in the EU and UK

This publication has been prepared by Trading Desk Strategists within the Sales and Trading functions of Santander US Capital Markets LLC (“SanCap”), the US registered broker-dealer of Santander Corporate & Investment Banking. This communication is distributed in the EEA by Banco Santander S.A., a credit institution registered in Spain and authorised and regulated by the Bank of Spain and the CNMV. Any EEA recipient of this communication that would like to affect any transaction in any security or issuer discussed herein should do so with Banco Santander S.A. or any of its affiliates (together “Santander”). This communication has been distributed in the UK by Banco Santander, S.A.’s London branch, authorised by the Bank of Spain and subject to regulatory oversight on certain matters by the Financial Conduct Authority (FCA) and the Prudential Regulation Authority (PRA).

The publication is intended for exclusive use for Professional Clients and Eligible Counterparties as defined by MiFID II and is not intended for use by retail customers or for any persons or entities in any jurisdictions or country where such distribution or use would be contrary to local law or regulation.

This material is not a product of Santander´s Research Team and does not constitute independent investment research. This is a marketing communication and may contain ¨investment recommendations¨ as defined by the Market Abuse Regulation 596/2014 ("MAR"). This publication has not been prepared in accordance with legal requirements designed to promote the independence of research and is not subject to any prohibition on dealing ahead of the dissemination of investment research. The author, date and time of the production of this publication are as indicated herein.

This publication does not constitute investment advice and may not be relied upon to form an investment decision, nor should it be construed as any offer to sell or issue or invitation to purchase, acquire or subscribe for any instruments referred herein. The publication has been prepared in good faith and based on information Santander considers reliable as of the date of publication, but Santander does not guarantee or represent, express or implied, that such information is accurate or complete. All estimates, forecasts and opinions are current as at the date of this publication and are subject to change without notice. Unless otherwise indicated, Santander does not intend to update this publication. The views and commentary in this publication may not be objective or independent of the interests of the Trading and Sales functions of Santander, who may be active participants in the markets, investments or strategies referred to herein and/or may receive compensation from investment banking and non-investment banking services from entities mentioned herein. Santander may trade as principal, make a market or hold positions in instruments (or related derivatives) and/or hold financial interest in entities discussed herein. Santander may provide market commentary or trading strategies to other clients or engage in transactions which may differ from views expressed herein. Santander may have acted upon the contents of this publication prior to you having received it.

This publication is intended for the exclusive use of the recipient and must not be reproduced, redistributed or transmitted, in whole or in part, without Santander’s consent. The recipient agrees to keep confidential at all times information contained herein.

The Library

Search Articles