Uncategorized
Prepayment speeds after servicing is sold
admin | July 19, 2019
This material is a Marketing Communication and does not constitute Independent Investment Research.
Mortgage servicers clearly have an impact on MBS prepayment speeds, which makes any change in servicers significant. Some servicers proactively alert borrowers to refinance and generally have pools with faster speeds and worse convexity. But loan servicing can be sold, and MBS value can quickly shift if the buyer shows materially faster or slower speeds. Some large originators routinely service their loans for only a few years before selling.
A few large originators only service their loans for a short period
Some originators only service their own loans for a year or two before selling to another servicer. At least seven lenders have sold most of the servicing for agency loans originated from 2014 to 2018 (Exhibit 1). In particular, four servicers—Pacific Union, Stearns Lending, Plaza Home Mortgage, and United Shore—have sold almost 100% of their pre-2018 loan servicing. All of these lenders continued to originate loans in 2018 and 2019. Most of these loans tend to be serviced for 12- to 18-months before sale.
Exhibit 1: Some originators sell most of their servicing relatively quickly
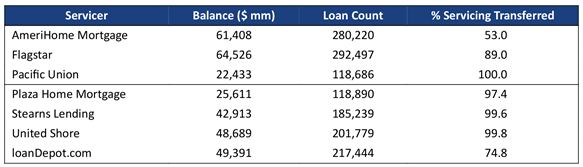
Source: Fannie Mae, Freddie Mac, Ginnie Mae, eMBS, Amherst Pierpont Securities
Speeds can go faster or slower after servicing is sold
The prepayment performance of these lenders’ pools varies greatly. The Amherst Pierpont servicer ranking report shows that United Shore and loanDepot.com have been extremely fast over the last year, while a lender like Plaza Home Mortgage has tended to be slower (Exhibit 2).
Exhibit 2: Speeds can change after servicing is sold
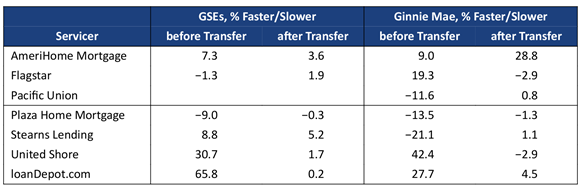
Source: Fannie Mae, Freddie Mac, Ginnie Mae, eMBS, Amherst Pierpont Securities
The “before Transfer” columns show the percentage faster or slower a servicer’s loans prepay, compared to a reference cohort of comparable loans. The “after Transfer” columns show the percentage faster or slower the servicing buyers’ prepayment speeds are compared to their reference cohort. For example, Plaza’s Ginnie Mae pools prepaid 13.5% slower than reference over the last 12 months, but they are selling to servicers that only prepaid 1.3% slower. So it is likely that Plaza’s loans would prepay faster after a sale. Prepayment S-curves (Exhibit 3) confirm that Plaza’s 2018 production prepaid faster after the servicing was sold.
Exhibit 3: United Shore loans slow down after servicing is sold
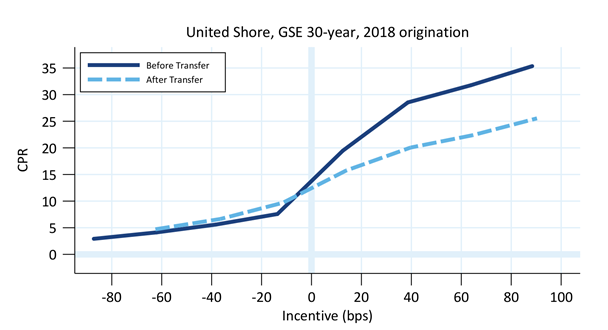
Source: Fannie Mae, Freddie Mac, Ginnie Mae, eMBS, Amherst Pierpont Securities
On the other hand, United Shore’s loans have prepaid 30.7% faster than the cohorts over the last 12 months. But the lenders acquiring their servicing have only prepaid 0.2% faster than their reference cohorts. So it is likely that United Shore’s speeds fell after the loans were sold, which is confirmed in the S-curves for United Shore’s 2018 production (Exhibit 4).
Exhibit 4: Plaza Mortgage loans speed up after servicing is sold
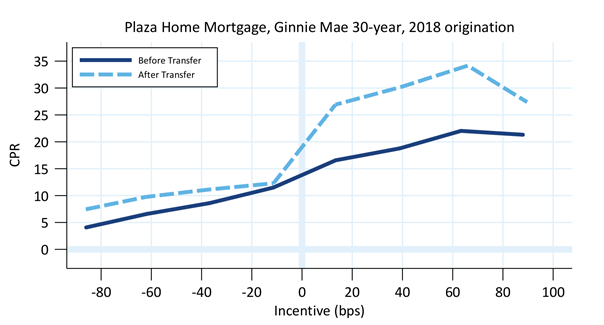
Source: Fannie Mae, Freddie Mac, Ginnie Mae, eMBS, Amherst Pierpont Securities
Valuing the potential servicing transfer
There is a significant valuation difference between assuming the current servicer’s loans continue to prepay faster or slower by the same amount forever, or if a factor like a servicing transfer might change speeds. This is well illustrated by looking at conventional 30-year 3.5% and 4.0% pools with a maximum loan size of $175,000 (Exhibit 5).
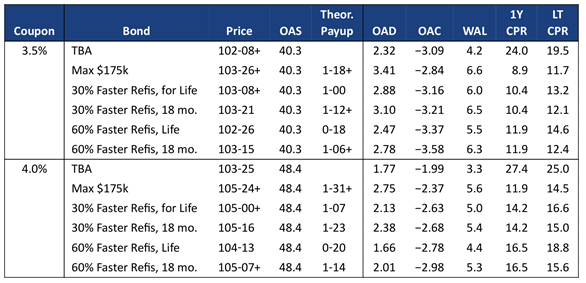
Exhibit 5: Theoretical pay-ups for Max $175,000 pools
Source: Fannie Mae, Freddie Mac, Ginnie Mae, eMBS, Amherst Pierpont Securities
The TBA is represented by the June Fannie Major pools, FN MA3692 and FN MA3693. For each coupon, a maximum $175,000 cash window pool (FN CA3863 and FN CA3868) is run at the same OAS to calculate its theoretical pay-up using Yield Book’s prepayment model. The theoretical pay-ups are $1-18+ and $1-31+, both of which are very close to the current pay-ups in the market.
For each coupon a United Shore max $175,000 pool is proxied by running the cash window pools with 1.3 and 1.6 refinance multipliers for the life of the pool. This significantly reduces the theoretical pay-up for the collateral. The pools are also run assuming that the faster speeds persist for the first 18 months, after which they revert to the cohort speed when the servicing is sold.
The theoretical pay-up increases substantially under the servicing transfer scenario compared to the fast speeds for life scenario. For example, assuming United Shore prepays 30% faster for life reduces the spec pay-up by $0-18+, but if speeds slow after 18 months the pay-up is only reduced by $0-06.
Many investors can’t bear the risk of fast near-term prepayments, which keeps prices on collateral from faster servicers low. An investor that can tolerate the faster initial speeds and the uncertainty around timing of a sale could do well by holding pools like this. The price of these pools should jump the instant the servicing is sold (and models should immediately reflect a change to a better servicer by an increase in OAS).
This material is intended only for institutional investors and does not carry all of the independence and disclosure standards of retail debt research reports. In the preparation of this material, the author may have consulted or otherwise discussed the matters referenced herein with one or more of SCM’s trading desks, any of which may have accumulated or otherwise taken a position, long or short, in any of the financial instruments discussed in or related to this material. Further, SCM may act as a market maker or principal dealer and may have proprietary interests that differ or conflict with the recipient hereof, in connection with any financial instrument discussed in or related to this material.
This message, including any attachments or links contained herein, is subject to important disclaimers, conditions, and disclosures regarding Electronic Communications, which you can find at https://portfolio-strategy.apsec.com/sancap-disclaimers-and-disclosures.
Important Disclaimers
Copyright © 2026 Santander US Capital Markets LLC and its affiliates (“SCM”). All rights reserved. SCM is a member of FINRA and SIPC. This material is intended for limited distribution to institutions only and is not publicly available. Any unauthorized use or disclosure is prohibited.
In making this material available, SCM (i) is not providing any advice to the recipient, including, without limitation, any advice as to investment, legal, accounting, tax and financial matters, (ii) is not acting as an advisor or fiduciary in respect of the recipient, (iii) is not making any predictions or projections and (iv) intends that any recipient to which SCM has provided this material is an “institutional investor” (as defined under applicable law and regulation, including FINRA Rule 4512 and that this material will not be disseminated, in whole or part, to any third party by the recipient.
The author of this material is an economist, desk strategist or trader. In the preparation of this material, the author may have consulted or otherwise discussed the matters referenced herein with one or more of SCM’s trading desks, any of which may have accumulated or otherwise taken a position, long or short, in any of the financial instruments discussed in or related to this material. Further, SCM or any of its affiliates may act as a market maker or principal dealer and may have proprietary interests that differ or conflict with the recipient hereof, in connection with any financial instrument discussed in or related to this material.
This material (i) has been prepared for information purposes only and does not constitute a solicitation or an offer to buy or sell any securities, related investments or other financial instruments, (ii) is neither research, a “research report” as commonly understood under the securities laws and regulations promulgated thereunder nor the product of a research department, (iii) or parts thereof may have been obtained from various sources, the reliability of which has not been verified and cannot be guaranteed by SCM, (iv) should not be reproduced or disclosed to any other person, without SCM’s prior consent and (v) is not intended for distribution in any jurisdiction in which its distribution would be prohibited.
In connection with this material, SCM (i) makes no representation or warranties as to the appropriateness or reliance for use in any transaction or as to the permissibility or legality of any financial instrument in any jurisdiction, (ii) believes the information in this material to be reliable, has not independently verified such information and makes no representation, express or implied, with regard to the accuracy or completeness of such information, (iii) accepts no responsibility or liability as to any reliance placed, or investment decision made, on the basis of such information by the recipient and (iv) does not undertake, and disclaims any duty to undertake, to update or to revise the information contained in this material.
Unless otherwise stated, the views, opinions, forecasts, valuations, or estimates contained in this material are those solely of the author, as of the date of publication of this material, and are subject to change without notice. The recipient of this material should make an independent evaluation of this information and make such other investigations as the recipient considers necessary (including obtaining independent financial advice), before transacting in any financial market or instrument discussed in or related to this material.
Important disclaimers for clients in the EU and UK
This publication has been prepared by Trading Desk Strategists within the Sales and Trading functions of Santander US Capital Markets LLC (“SanCap”), the US registered broker-dealer of Santander Corporate & Investment Banking. This communication is distributed in the EEA by Banco Santander S.A., a credit institution registered in Spain and authorised and regulated by the Bank of Spain and the CNMV. Any EEA recipient of this communication that would like to affect any transaction in any security or issuer discussed herein should do so with Banco Santander S.A. or any of its affiliates (together “Santander”). This communication has been distributed in the UK by Banco Santander, S.A.’s London branch, authorised by the Bank of Spain and subject to regulatory oversight on certain matters by the Financial Conduct Authority (FCA) and the Prudential Regulation Authority (PRA).
The publication is intended for exclusive use for Professional Clients and Eligible Counterparties as defined by MiFID II and is not intended for use by retail customers or for any persons or entities in any jurisdictions or country where such distribution or use would be contrary to local law or regulation.
This material is not a product of Santander´s Research Team and does not constitute independent investment research. This is a marketing communication and may contain ¨investment recommendations¨ as defined by the Market Abuse Regulation 596/2014 ("MAR"). This publication has not been prepared in accordance with legal requirements designed to promote the independence of research and is not subject to any prohibition on dealing ahead of the dissemination of investment research. The author, date and time of the production of this publication are as indicated herein.
This publication does not constitute investment advice and may not be relied upon to form an investment decision, nor should it be construed as any offer to sell or issue or invitation to purchase, acquire or subscribe for any instruments referred herein. The publication has been prepared in good faith and based on information Santander considers reliable as of the date of publication, but Santander does not guarantee or represent, express or implied, that such information is accurate or complete. All estimates, forecasts and opinions are current as at the date of this publication and are subject to change without notice. Unless otherwise indicated, Santander does not intend to update this publication. The views and commentary in this publication may not be objective or independent of the interests of the Trading and Sales functions of Santander, who may be active participants in the markets, investments or strategies referred to herein and/or may receive compensation from investment banking and non-investment banking services from entities mentioned herein. Santander may trade as principal, make a market or hold positions in instruments (or related derivatives) and/or hold financial interest in entities discussed herein. Santander may provide market commentary or trading strategies to other clients or engage in transactions which may differ from views expressed herein. Santander may have acted upon the contents of this publication prior to you having received it.
This publication is intended for the exclusive use of the recipient and must not be reproduced, redistributed or transmitted, in whole or in part, without Santander’s consent. The recipient agrees to keep confidential at all times information contained herein.


