Uncategorized
Aetna 15-year bonds most attractive part of CVS/AET capital structure
admin | July 19, 2019
This material is a Marketing Communication and does not constitute Independent Investment Research.
Aetna bonds trade through parent CVS with the exception of the 15-year part of the curve, making it the most attractive part of the capital structure. Aetna bonds are structurally senior to those of CVS, the operating companies are well capitalized, and Aetna’s standalone leverage should improve over time.
Background
After highlighting a trade in CVS last week, the AET 6.625% 6/15/36 and 6.75% 12/15/37 bonds are the most attractive part of the CVS/AET capital structure. Across the curve, AET bonds trade through CVS with the exception of the 15-year part of the curve. While Aetna Inc. (AET – Baa2 (n)/BBB) is a wholly owned subsidiary of CVS, the CVS bonds are structurally subordinated to AET bonds as noted in CVS’ debt prospectus supplement (filed 3/6/18), thereby making AET structurally senior despite the equalized ratings. CVS is also committed to AET’s existing financial policies which include keeping AET’s operating companies well capitalized, at a combined risk-based capital ratio of 275% or higher, in order to provide some “insulation” from the parent and maintain strong insurance financial strength (IFS) ratings. Moody’s , Fitch and A.M. Best all currently have a mid-single A IFS rating for AET, while S&P is one notch lower at A-.
Exhibit 1: AET-CVS curve
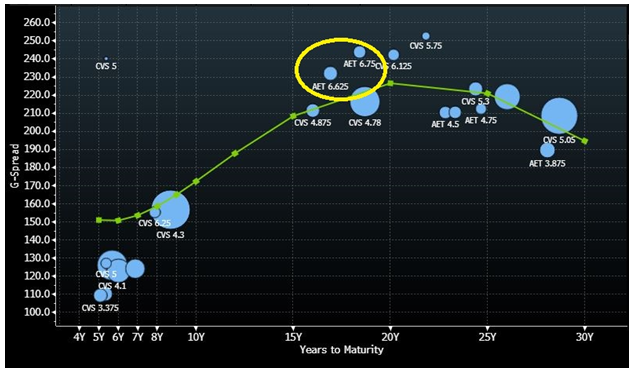
Source: Bloomberg
AET a strong operator
Prior to linking up with CVS, AET was considered a strong operator in the HMO sector, benefiting from its size and scale as well as the depth of its provider network. AET consistently posted strong profitability primarily due to its disciplined pricing and underwriting approach. For the three fiscal years prior to CVS, AET posted an average return on revenue (ROR) of 8.8%. S&P forecasts an ROR of 7%-8% for 2019-2020, which compares favorably to S&P’s 2%-5% forecast for the industry over the same time period. Furthermore, AET remains very conservative, maintaining an RBC ratio of 275% or higher is both above regulatory requirements, as well as its peers, who look to maintain RBC in the 225%-275% range.
AET leverage to improve over time
CVS has been very vocal about its commitment to reducing adjusted combined leverage from 4.7x at acquisition close, to mid-3.0x leverage by 2021 and low-3.0x by 2022. Based on cash flow estimates and CVS’ track record, the debt reduction targets appear to be attainable. When the acquisition closed, CVS made the decision to centralize the treasury operations for both CVS and AET. With a central treasury, the agencies view AET’s liquidity and financial flexibility to be tied CVS. However, on a go forward basis, any future debt issuance will be done out of CVS. That said, AET’s stand-alone leverage will improve over time as AET debt matures and is either repaid or refinanced out of the CVS parent. AET’s next debt maturity is on 6/1/21 when $500 million of debt comes due.
This material is intended only for institutional investors and does not carry all of the independence and disclosure standards of retail debt research reports. In the preparation of this material, the author may have consulted or otherwise discussed the matters referenced herein with one or more of SCM’s trading desks, any of which may have accumulated or otherwise taken a position, long or short, in any of the financial instruments discussed in or related to this material. Further, SCM may act as a market maker or principal dealer and may have proprietary interests that differ or conflict with the recipient hereof, in connection with any financial instrument discussed in or related to this material.
This message, including any attachments or links contained herein, is subject to important disclaimers, conditions, and disclosures regarding Electronic Communications, which you can find at https://portfolio-strategy.apsec.com/sancap-disclaimers-and-disclosures.
Important Disclaimers
Copyright © 2026 Santander US Capital Markets LLC and its affiliates (“SCM”). All rights reserved. SCM is a member of FINRA and SIPC. This material is intended for limited distribution to institutions only and is not publicly available. Any unauthorized use or disclosure is prohibited.
In making this material available, SCM (i) is not providing any advice to the recipient, including, without limitation, any advice as to investment, legal, accounting, tax and financial matters, (ii) is not acting as an advisor or fiduciary in respect of the recipient, (iii) is not making any predictions or projections and (iv) intends that any recipient to which SCM has provided this material is an “institutional investor” (as defined under applicable law and regulation, including FINRA Rule 4512 and that this material will not be disseminated, in whole or part, to any third party by the recipient.
The author of this material is an economist, desk strategist or trader. In the preparation of this material, the author may have consulted or otherwise discussed the matters referenced herein with one or more of SCM’s trading desks, any of which may have accumulated or otherwise taken a position, long or short, in any of the financial instruments discussed in or related to this material. Further, SCM or any of its affiliates may act as a market maker or principal dealer and may have proprietary interests that differ or conflict with the recipient hereof, in connection with any financial instrument discussed in or related to this material.
This material (i) has been prepared for information purposes only and does not constitute a solicitation or an offer to buy or sell any securities, related investments or other financial instruments, (ii) is neither research, a “research report” as commonly understood under the securities laws and regulations promulgated thereunder nor the product of a research department, (iii) or parts thereof may have been obtained from various sources, the reliability of which has not been verified and cannot be guaranteed by SCM, (iv) should not be reproduced or disclosed to any other person, without SCM’s prior consent and (v) is not intended for distribution in any jurisdiction in which its distribution would be prohibited.
In connection with this material, SCM (i) makes no representation or warranties as to the appropriateness or reliance for use in any transaction or as to the permissibility or legality of any financial instrument in any jurisdiction, (ii) believes the information in this material to be reliable, has not independently verified such information and makes no representation, express or implied, with regard to the accuracy or completeness of such information, (iii) accepts no responsibility or liability as to any reliance placed, or investment decision made, on the basis of such information by the recipient and (iv) does not undertake, and disclaims any duty to undertake, to update or to revise the information contained in this material.
Unless otherwise stated, the views, opinions, forecasts, valuations, or estimates contained in this material are those solely of the author, as of the date of publication of this material, and are subject to change without notice. The recipient of this material should make an independent evaluation of this information and make such other investigations as the recipient considers necessary (including obtaining independent financial advice), before transacting in any financial market or instrument discussed in or related to this material.
Important disclaimers for clients in the EU and UK
This publication has been prepared by Trading Desk Strategists within the Sales and Trading functions of Santander US Capital Markets LLC (“SanCap”), the US registered broker-dealer of Santander Corporate & Investment Banking. This communication is distributed in the EEA by Banco Santander S.A., a credit institution registered in Spain and authorised and regulated by the Bank of Spain and the CNMV. Any EEA recipient of this communication that would like to affect any transaction in any security or issuer discussed herein should do so with Banco Santander S.A. or any of its affiliates (together “Santander”). This communication has been distributed in the UK by Banco Santander, S.A.’s London branch, authorised by the Bank of Spain and subject to regulatory oversight on certain matters by the Financial Conduct Authority (FCA) and the Prudential Regulation Authority (PRA).
The publication is intended for exclusive use for Professional Clients and Eligible Counterparties as defined by MiFID II and is not intended for use by retail customers or for any persons or entities in any jurisdictions or country where such distribution or use would be contrary to local law or regulation.
This material is not a product of Santander´s Research Team and does not constitute independent investment research. This is a marketing communication and may contain ¨investment recommendations¨ as defined by the Market Abuse Regulation 596/2014 ("MAR"). This publication has not been prepared in accordance with legal requirements designed to promote the independence of research and is not subject to any prohibition on dealing ahead of the dissemination of investment research. The author, date and time of the production of this publication are as indicated herein.
This publication does not constitute investment advice and may not be relied upon to form an investment decision, nor should it be construed as any offer to sell or issue or invitation to purchase, acquire or subscribe for any instruments referred herein. The publication has been prepared in good faith and based on information Santander considers reliable as of the date of publication, but Santander does not guarantee or represent, express or implied, that such information is accurate or complete. All estimates, forecasts and opinions are current as at the date of this publication and are subject to change without notice. Unless otherwise indicated, Santander does not intend to update this publication. The views and commentary in this publication may not be objective or independent of the interests of the Trading and Sales functions of Santander, who may be active participants in the markets, investments or strategies referred to herein and/or may receive compensation from investment banking and non-investment banking services from entities mentioned herein. Santander may trade as principal, make a market or hold positions in instruments (or related derivatives) and/or hold financial interest in entities discussed herein. Santander may provide market commentary or trading strategies to other clients or engage in transactions which may differ from views expressed herein. Santander may have acted upon the contents of this publication prior to you having received it.
This publication is intended for the exclusive use of the recipient and must not be reproduced, redistributed or transmitted, in whole or in part, without Santander’s consent. The recipient agrees to keep confidential at all times information contained herein.


