Uncategorized
TBA dollar rolls rise in 2019
admin | July 12, 2019
This material is a Marketing Communication and does not constitute Independent Investment Research.
The Fed’s continuing exit from the MBS market has coincided with a significant rise in average daily TBA dollar roll trading, with flows from mid-2018 to mid-2019 nearly doubling. Fed MBS balances have dropped by $189 billion over that period and outstanding MBS have increased by $149 billion. Higher balances in private hands, the ongoing transition to uniform MBS, special financing in a number of dollar rolls this year and a rise in MBS refinancing all may be contributing to the rising tide of activity.
Dollar roll trading has surged over the last year
Dollar roll trading has increased sharply since the middle of 2018. Average daily dollar roll volumes reported by the New York Fed have almost doubled from roughly $77 billion in July 2018 to almost $140 billion in March 2019 (Exhibit 1). Dollar roll volumes have tapered off over the last couple of months but still remain very high.
Exhibit 1: Agency MBS dollar roll volume has jumped higher in 2019
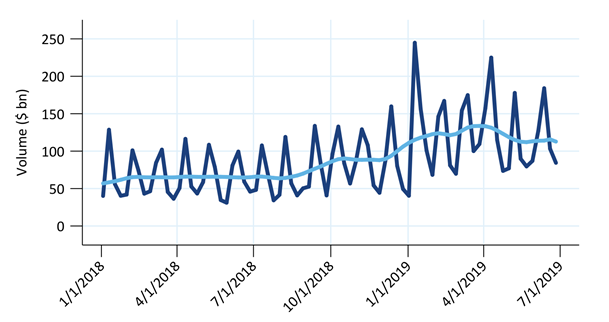
Note: The dark blue line is weekly trading volume, the light blue line is a running average fit using LOESS. The data do not include cash transactions. Source: Federal Reserve Bank of New York, Amherst Pierpont Securities
The increased dollar roll trading may be related to the reduction of Fed MBS purchases throughout 2018. The Fed started reducing MBS balance in October 2017. Prior to that date, the Fed reinvested 100% of MBS paydowns into new MBS. Beginning in October the Fed permitted up to $4 billion of paydowns per month to run off their portfolio. This implies that the pools the Fed would have bought without QE were instead purchased by private investors.
Every quarter in 2018 the Fed increased the amount of MBS that they would permit to run off by an additional $4 billion per month, until reaching a maximum of $20 billion per month runoff in October 2018. Increases in the runoff cap decrease the Fed’s MBS purchases. In mid-2018 the Fed was purchasing less than $10 billion of MBS per month, and the amount fell below $1.0 billion per month starting in October 2018.
The Fed does not appear to have conducted any dollar roll transactions over the past few years. The Fed reports sale transactions, and all of the few sales reported were specified pool sales. It is likely that the private investors that replaced the Fed’s MBS purchases would dollar roll, and this accounts for some of the increase in activity.
TBA trading remains strong after UMBS
The clear rise in dollar roll volume as also come as the MBS market transitions to a single agency TBA security or Uniform Mortgage Backed Security. The anticipated and actual pooling of Fannie Mae and Freddie Mac securities into a single TBA market may also be contributing to better volume. TBA UMBS contracts started trading in March, and exchange of Freddie Mac Gold PC MBS for UMBS started in May. So far, investors have exchanged $144 billion of PCs for UMBS. This is a good first sign that UMBS has not hurt, and possibly improved, TBA liquidity.
Special financing and mortgage refinancing
Over the last few months most conventional 30-year rolls have generally offered financing very close to 1-month LIBOR. However the 3.0% roll has at times offered better financing rates and is running special today. This roll currently offers financing at 2.03%, which is about 30 basis points lower than 1-month LIBOR (2.33%).
Ginnie Mae II rolls have gone special more often than conventional rolls over the last few months, and in coupons ranging from 3.0% to 5.0%. And all of these rolls are currently offering special financing, well below 1-month LIBOR–the Ginnie II 3.0% roll is financing at 1.30%, the 3.5% roll at 0.73%, the 4.0% roll at 0.93%, the 4.5% roll at 1.35%, and the 5.0% roll at 1.93%.
The drop in interest rates this year and the rise in mortgage refinancing may also be adding to the rising dollar roll volume. Mortgage originators routinely hedge originations with TBA contracts and roll those contracts to manage pipeline interest rate risk. The MBA Refinancing Index has jumped from 1,335.6 on 5/31/2019 to 1,799.7 most recently, and the rising refi activity also may be driving the flow of dollar rolls.
While overall MBS trading volume has not surged as much as dollar rolls this year, it remains robust. But the relative rise in dollar rolling points to a larger share of MBS exposure coming through TBA forward contracts and dollar rolls than through cash positions.
This material is intended only for institutional investors and does not carry all of the independence and disclosure standards of retail debt research reports. In the preparation of this material, the author may have consulted or otherwise discussed the matters referenced herein with one or more of SCM’s trading desks, any of which may have accumulated or otherwise taken a position, long or short, in any of the financial instruments discussed in or related to this material. Further, SCM may act as a market maker or principal dealer and may have proprietary interests that differ or conflict with the recipient hereof, in connection with any financial instrument discussed in or related to this material.
This message, including any attachments or links contained herein, is subject to important disclaimers, conditions, and disclosures regarding Electronic Communications, which you can find at https://portfolio-strategy.apsec.com/sancap-disclaimers-and-disclosures.
Important Disclaimers
Copyright © 2026 Santander US Capital Markets LLC and its affiliates (“SCM”). All rights reserved. SCM is a member of FINRA and SIPC. This material is intended for limited distribution to institutions only and is not publicly available. Any unauthorized use or disclosure is prohibited.
In making this material available, SCM (i) is not providing any advice to the recipient, including, without limitation, any advice as to investment, legal, accounting, tax and financial matters, (ii) is not acting as an advisor or fiduciary in respect of the recipient, (iii) is not making any predictions or projections and (iv) intends that any recipient to which SCM has provided this material is an “institutional investor” (as defined under applicable law and regulation, including FINRA Rule 4512 and that this material will not be disseminated, in whole or part, to any third party by the recipient.
The author of this material is an economist, desk strategist or trader. In the preparation of this material, the author may have consulted or otherwise discussed the matters referenced herein with one or more of SCM’s trading desks, any of which may have accumulated or otherwise taken a position, long or short, in any of the financial instruments discussed in or related to this material. Further, SCM or any of its affiliates may act as a market maker or principal dealer and may have proprietary interests that differ or conflict with the recipient hereof, in connection with any financial instrument discussed in or related to this material.
This material (i) has been prepared for information purposes only and does not constitute a solicitation or an offer to buy or sell any securities, related investments or other financial instruments, (ii) is neither research, a “research report” as commonly understood under the securities laws and regulations promulgated thereunder nor the product of a research department, (iii) or parts thereof may have been obtained from various sources, the reliability of which has not been verified and cannot be guaranteed by SCM, (iv) should not be reproduced or disclosed to any other person, without SCM’s prior consent and (v) is not intended for distribution in any jurisdiction in which its distribution would be prohibited.
In connection with this material, SCM (i) makes no representation or warranties as to the appropriateness or reliance for use in any transaction or as to the permissibility or legality of any financial instrument in any jurisdiction, (ii) believes the information in this material to be reliable, has not independently verified such information and makes no representation, express or implied, with regard to the accuracy or completeness of such information, (iii) accepts no responsibility or liability as to any reliance placed, or investment decision made, on the basis of such information by the recipient and (iv) does not undertake, and disclaims any duty to undertake, to update or to revise the information contained in this material.
Unless otherwise stated, the views, opinions, forecasts, valuations, or estimates contained in this material are those solely of the author, as of the date of publication of this material, and are subject to change without notice. The recipient of this material should make an independent evaluation of this information and make such other investigations as the recipient considers necessary (including obtaining independent financial advice), before transacting in any financial market or instrument discussed in or related to this material.
Important disclaimers for clients in the EU and UK
This publication has been prepared by Trading Desk Strategists within the Sales and Trading functions of Santander US Capital Markets LLC (“SanCap”), the US registered broker-dealer of Santander Corporate & Investment Banking. This communication is distributed in the EEA by Banco Santander S.A., a credit institution registered in Spain and authorised and regulated by the Bank of Spain and the CNMV. Any EEA recipient of this communication that would like to affect any transaction in any security or issuer discussed herein should do so with Banco Santander S.A. or any of its affiliates (together “Santander”). This communication has been distributed in the UK by Banco Santander, S.A.’s London branch, authorised by the Bank of Spain and subject to regulatory oversight on certain matters by the Financial Conduct Authority (FCA) and the Prudential Regulation Authority (PRA).
The publication is intended for exclusive use for Professional Clients and Eligible Counterparties as defined by MiFID II and is not intended for use by retail customers or for any persons or entities in any jurisdictions or country where such distribution or use would be contrary to local law or regulation.
This material is not a product of Santander´s Research Team and does not constitute independent investment research. This is a marketing communication and may contain ¨investment recommendations¨ as defined by the Market Abuse Regulation 596/2014 ("MAR"). This publication has not been prepared in accordance with legal requirements designed to promote the independence of research and is not subject to any prohibition on dealing ahead of the dissemination of investment research. The author, date and time of the production of this publication are as indicated herein.
This publication does not constitute investment advice and may not be relied upon to form an investment decision, nor should it be construed as any offer to sell or issue or invitation to purchase, acquire or subscribe for any instruments referred herein. The publication has been prepared in good faith and based on information Santander considers reliable as of the date of publication, but Santander does not guarantee or represent, express or implied, that such information is accurate or complete. All estimates, forecasts and opinions are current as at the date of this publication and are subject to change without notice. Unless otherwise indicated, Santander does not intend to update this publication. The views and commentary in this publication may not be objective or independent of the interests of the Trading and Sales functions of Santander, who may be active participants in the markets, investments or strategies referred to herein and/or may receive compensation from investment banking and non-investment banking services from entities mentioned herein. Santander may trade as principal, make a market or hold positions in instruments (or related derivatives) and/or hold financial interest in entities discussed herein. Santander may provide market commentary or trading strategies to other clients or engage in transactions which may differ from views expressed herein. Santander may have acted upon the contents of this publication prior to you having received it.
This publication is intended for the exclusive use of the recipient and must not be reproduced, redistributed or transmitted, in whole or in part, without Santander’s consent. The recipient agrees to keep confidential at all times information contained herein.


