Uncategorized
Lower risk portfolios lead the APS Top 100 into June
admin | July 12, 2019
This material is a Marketing Communication and does not constitute Independent Investment Research.
Managers holding lower risk portfolios helped generate the best total returns on CLO leveraged loans for the three months ending in June. The APS CLO Total Return Top 100 beat the S&P/LSTA index by an average of 88 bp, although a few standout performances inflated that margin. CLOs below the Top 100 trailed the index by an average of 8 bp. Anchorage Capital Group and CIFC Asset Management led the list of managers with deals in the Top 100 for the second straight month by each placing eight deals on the board.
Cumulative 3-month returns through June in the Top 100 ranged from 18.22% to 0.28% above the index (Exhibit 1). Three deals managed by Highland Capital Management raised Top 100 performance by printing cumulative returns of 18.22%, 16.98% and 8.67%. All three deals came to market before 2008 and are well past the end of reinvestment. Each reported substantial gains in the market value and par amount of portfolio loans. Excluding those deals, the Top 100 beat the index by an average of 46 bp.
For the remaining 634 CLO tracked by APS that fell below the Top 100, cumulative performance against the index varied from 0.28% to -4.18%.
Deals in the Top 100 with a track record of returns long enough for reliable estimates showed a life-to-date average excess return of 4.6 bp a month and a beta or sensitivity to the S&P/LSTA index of 0.93. That compares to deals below the Top 100 with an average excess return of 2.0 bp and a beta of 0.97. This is the first time since APS began issuing the Top 100 this year that the leading deals showed a lower beta than the lagging deals.
The better performance by relatively less risky, low beta portfolios partly reflects the drop in averaged leveraged loan prices in May and June. The price of an average S&P/LSTA loan from April 30 to June 30 dropped from $97.52 to $96.79. Low beta portfolios tend to drop by less than the average.
APS tracks monthly returns on all CLO loan portfolios starting three months after deal pricing. Returns include loan price performance, trading gains and losses, receipt and reinvestment of cash and accrued interest. CLO reporting periods vary widely, so APS matches return on the S&P/LSTA index to each CLO’s reporting period and then subtracts index performance. Performance for June includes cumulative net returns on 734 CLO portfolios for the three most recent reporting periods ending June 20.
APS measures market beta over the full life of a CLO deal, so the beta going into the most recent 3-month period may not accurately reflect the riskiness of a CLO portfolio if the manager changed portfolio strategy. The beta does show the manager’s historic average risk relative to the broad market.
Exhibit 1: The APS CLO Total Return Top 100 for June 2019
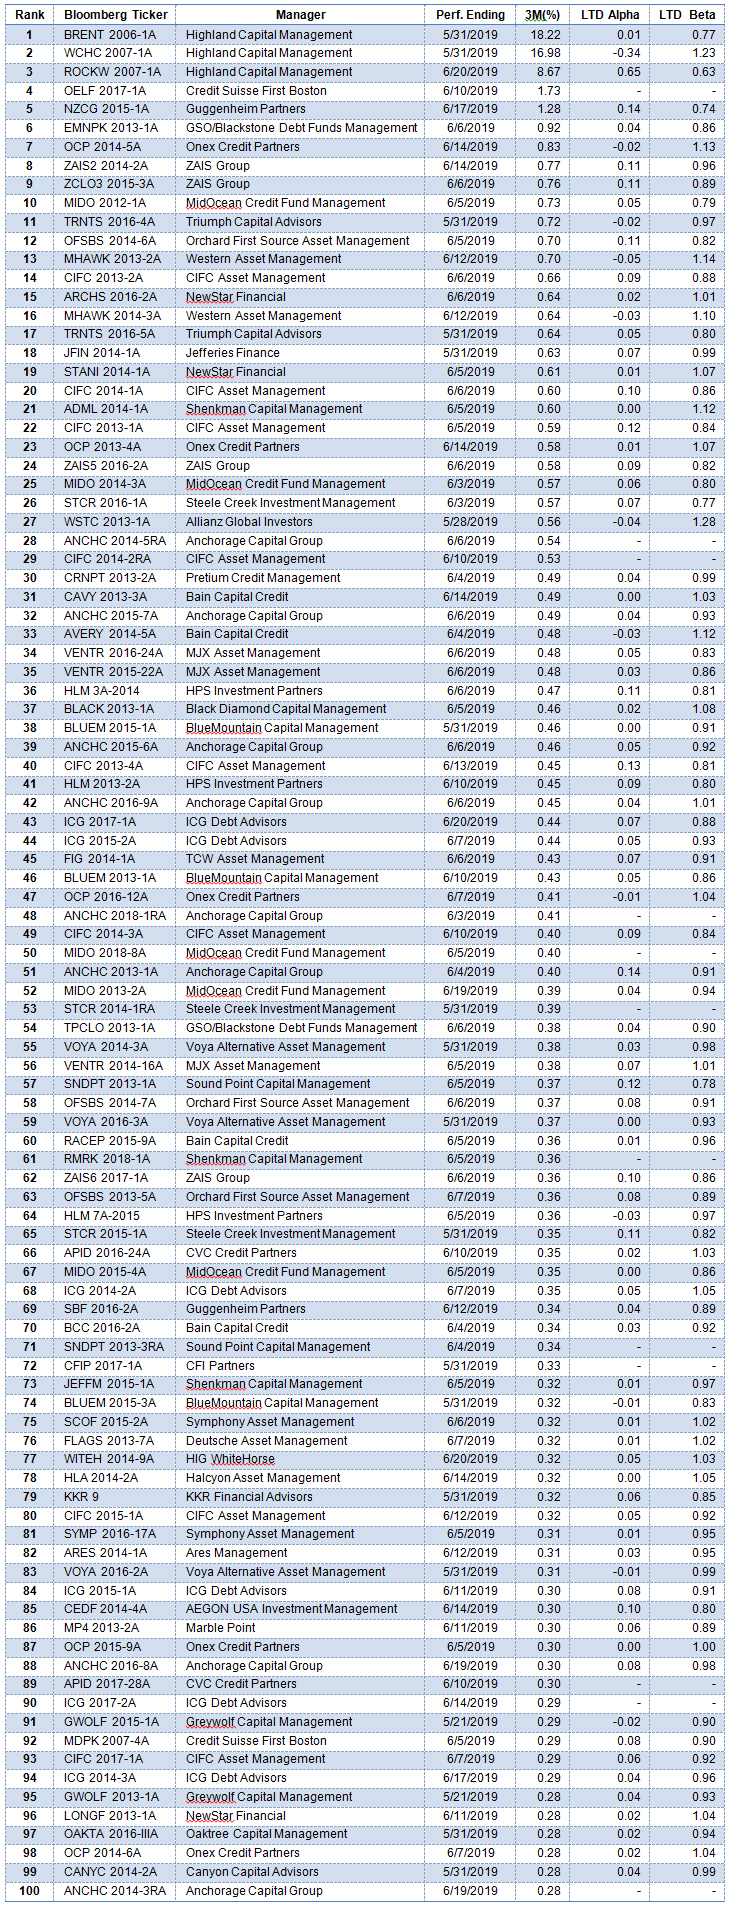
Note: 3M shows estimated returns on the CLO leveraged loan portfolio net of returns over the same period on the S&P/LSTA index. Alpha shows average excess return in basis points per month over the life of the deal usually starting six months after pricing. Beta shows the usual return in the CLO leveraged loan portfolio for a 1% return in the S&P/LSTA index. Deals with no alpha and no beta had less than 18 months of performance or unresolved data reporting errors. Source: Amherst Pierpont Securities
Anchorage and CIFC lead again
Anchorage Capital Group and CIFC Asset Management led a list of 40 managers by placing eight portfolios in the Top 100 (Exhibit 2). Anchorage placed eight of nine active deals with at least three months of performance, while CIFC placed eight of 19. ICG Debt Advisors, MidOcean Credit Fund Management and Onex Credit Partners rounded out the top five.
Manager performance over time should reflect both total portfolio risk, or beta, and ability to generate excess return through different market conditions, or alpha.
Exhibit 2: The managers of the Top 100 for June 2019
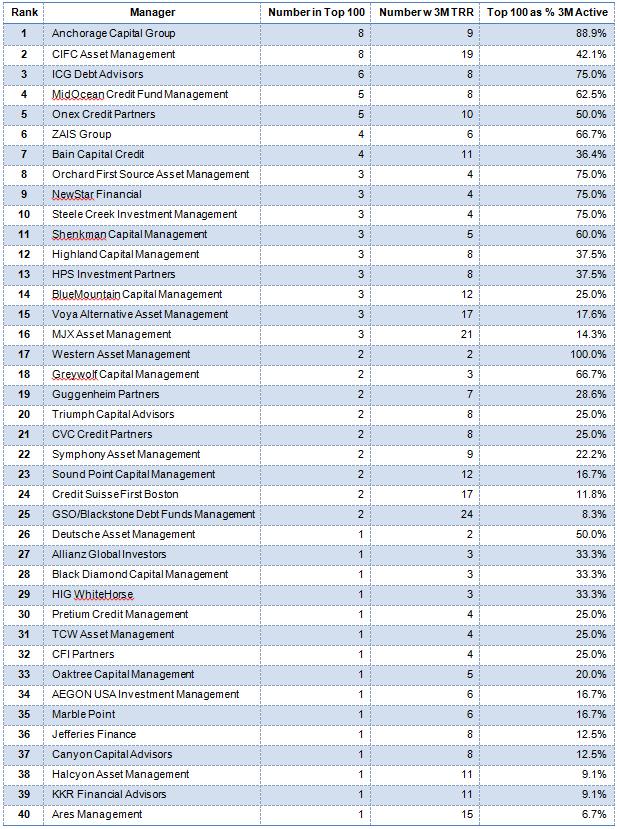
Source: Amherst Pierpont Securities
This material is intended only for institutional investors and does not carry all of the independence and disclosure standards of retail debt research reports. In the preparation of this material, the author may have consulted or otherwise discussed the matters referenced herein with one or more of SCM’s trading desks, any of which may have accumulated or otherwise taken a position, long or short, in any of the financial instruments discussed in or related to this material. Further, SCM may act as a market maker or principal dealer and may have proprietary interests that differ or conflict with the recipient hereof, in connection with any financial instrument discussed in or related to this material.
This message, including any attachments or links contained herein, is subject to important disclaimers, conditions, and disclosures regarding Electronic Communications, which you can find at https://portfolio-strategy.apsec.com/sancap-disclaimers-and-disclosures.
Important Disclaimers
Copyright © 2026 Santander US Capital Markets LLC and its affiliates (“SCM”). All rights reserved. SCM is a member of FINRA and SIPC. This material is intended for limited distribution to institutions only and is not publicly available. Any unauthorized use or disclosure is prohibited.
In making this material available, SCM (i) is not providing any advice to the recipient, including, without limitation, any advice as to investment, legal, accounting, tax and financial matters, (ii) is not acting as an advisor or fiduciary in respect of the recipient, (iii) is not making any predictions or projections and (iv) intends that any recipient to which SCM has provided this material is an “institutional investor” (as defined under applicable law and regulation, including FINRA Rule 4512 and that this material will not be disseminated, in whole or part, to any third party by the recipient.
The author of this material is an economist, desk strategist or trader. In the preparation of this material, the author may have consulted or otherwise discussed the matters referenced herein with one or more of SCM’s trading desks, any of which may have accumulated or otherwise taken a position, long or short, in any of the financial instruments discussed in or related to this material. Further, SCM or any of its affiliates may act as a market maker or principal dealer and may have proprietary interests that differ or conflict with the recipient hereof, in connection with any financial instrument discussed in or related to this material.
This material (i) has been prepared for information purposes only and does not constitute a solicitation or an offer to buy or sell any securities, related investments or other financial instruments, (ii) is neither research, a “research report” as commonly understood under the securities laws and regulations promulgated thereunder nor the product of a research department, (iii) or parts thereof may have been obtained from various sources, the reliability of which has not been verified and cannot be guaranteed by SCM, (iv) should not be reproduced or disclosed to any other person, without SCM’s prior consent and (v) is not intended for distribution in any jurisdiction in which its distribution would be prohibited.
In connection with this material, SCM (i) makes no representation or warranties as to the appropriateness or reliance for use in any transaction or as to the permissibility or legality of any financial instrument in any jurisdiction, (ii) believes the information in this material to be reliable, has not independently verified such information and makes no representation, express or implied, with regard to the accuracy or completeness of such information, (iii) accepts no responsibility or liability as to any reliance placed, or investment decision made, on the basis of such information by the recipient and (iv) does not undertake, and disclaims any duty to undertake, to update or to revise the information contained in this material.
Unless otherwise stated, the views, opinions, forecasts, valuations, or estimates contained in this material are those solely of the author, as of the date of publication of this material, and are subject to change without notice. The recipient of this material should make an independent evaluation of this information and make such other investigations as the recipient considers necessary (including obtaining independent financial advice), before transacting in any financial market or instrument discussed in or related to this material.
Important disclaimers for clients in the EU and UK
This publication has been prepared by Trading Desk Strategists within the Sales and Trading functions of Santander US Capital Markets LLC (“SanCap”), the US registered broker-dealer of Santander Corporate & Investment Banking. This communication is distributed in the EEA by Banco Santander S.A., a credit institution registered in Spain and authorised and regulated by the Bank of Spain and the CNMV. Any EEA recipient of this communication that would like to affect any transaction in any security or issuer discussed herein should do so with Banco Santander S.A. or any of its affiliates (together “Santander”). This communication has been distributed in the UK by Banco Santander, S.A.’s London branch, authorised by the Bank of Spain and subject to regulatory oversight on certain matters by the Financial Conduct Authority (FCA) and the Prudential Regulation Authority (PRA).
The publication is intended for exclusive use for Professional Clients and Eligible Counterparties as defined by MiFID II and is not intended for use by retail customers or for any persons or entities in any jurisdictions or country where such distribution or use would be contrary to local law or regulation.
This material is not a product of Santander´s Research Team and does not constitute independent investment research. This is a marketing communication and may contain ¨investment recommendations¨ as defined by the Market Abuse Regulation 596/2014 ("MAR"). This publication has not been prepared in accordance with legal requirements designed to promote the independence of research and is not subject to any prohibition on dealing ahead of the dissemination of investment research. The author, date and time of the production of this publication are as indicated herein.
This publication does not constitute investment advice and may not be relied upon to form an investment decision, nor should it be construed as any offer to sell or issue or invitation to purchase, acquire or subscribe for any instruments referred herein. The publication has been prepared in good faith and based on information Santander considers reliable as of the date of publication, but Santander does not guarantee or represent, express or implied, that such information is accurate or complete. All estimates, forecasts and opinions are current as at the date of this publication and are subject to change without notice. Unless otherwise indicated, Santander does not intend to update this publication. The views and commentary in this publication may not be objective or independent of the interests of the Trading and Sales functions of Santander, who may be active participants in the markets, investments or strategies referred to herein and/or may receive compensation from investment banking and non-investment banking services from entities mentioned herein. Santander may trade as principal, make a market or hold positions in instruments (or related derivatives) and/or hold financial interest in entities discussed herein. Santander may provide market commentary or trading strategies to other clients or engage in transactions which may differ from views expressed herein. Santander may have acted upon the contents of this publication prior to you having received it.
This publication is intended for the exclusive use of the recipient and must not be reproduced, redistributed or transmitted, in whole or in part, without Santander’s consent. The recipient agrees to keep confidential at all times information contained herein.


