Uncategorized
A wild ride but strength in household balance sheets
admin | June 21, 2019
This material is a Marketing Communication and does not constitute Independent Investment Research.
The fourth quarter of 2018 was a difficult one for asset prices. Stock indices fell sharply. Household balance sheets took a hit as a result. Fortunately, for equity owners, stock prices rebounded in the first three months of 2019, creating a woolly round trip for household asset values that brought things back by March 31 to roughly where they had been six months before.
Household asset values
The Federal Reserve’s quarterly Financial Accounts of the United States provide detailed information on household balance sheets. Household assets total over $120 trillion (the Fed includes nonprofit organizations in its household sector balance sheet tables). The largest two components, not surprisingly, are real estate and equities, each of which accounts for close to $30 trillion. The latter includes stocks directly held, mutual fund positions, and indirect holdings that accrue to households from life insurance and pension/retirement accounts.
The most recent release, which covered the first quarter of 2019, detailed a roller-coaster like ride for equity values. Stock prices sank when the S&P 500 dropped by 14% from September 28 to December 31, which slashed over $5 trillion from household balance sheets. But equity indices rebounded from December 31, 2018 to March 29, 2019, rising 13%. As a result, household equity holdings rose in value in the first quarter by $3.2 trillion.Overall household assets sank by nearly $4 trillion in the fourth quarter of last year but bounced back by almost $5 trillion in the first three months of 2019, establishing another new record of $124.7 trillion.
Similarly, the Federal Reserve’s measure of household net worth slid by $4 trillion in the fourth quarter of last year and bounced by almost $5 trillion in the first quarter of this year, jumping to over $108 trillion. Net worth as a percentage of disposable income slipped by 33 percentage points in the fourth quarter but made 25 percentage points back in early 2019 (see Exhibits 1 and 2). Exhibit 1 shows the long history of the series, which emphasizes how wealthy households are today relative to prior episodes. Exhibit 2 shows the same data over a much shorter time period, so that the harrowing round trip over the turn of the year is more evident.
Exhibit 1: Net worth to disposable income ratio
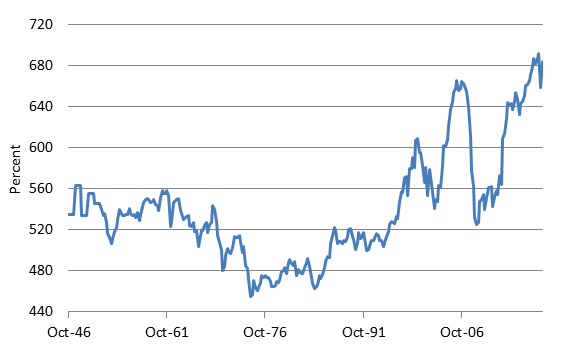
Source: Federal Reserve
Exhibit 2: Net worth to disposable income ratio 2008-2019
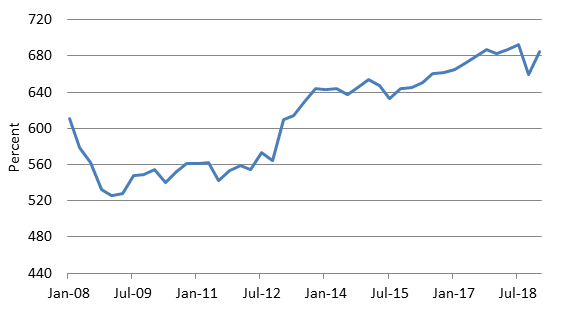
Source: Federal Reserve
Household debt
The extraordinary run-up in household net worth in the current expansion has been driven not only by rising asset values but also by remarkable restraint on the debt front. Having overextended themselves during the go-go 2000s, many households have turned far more conservative in the wake of the Financial Crisis. In fact, after peaking at just under 100% of GDP in 2009, household debt has been falling in relation to the size of the economy for a decade (see Exhibit 3).
Exhibit 3: Household debt-to-GDP ratio
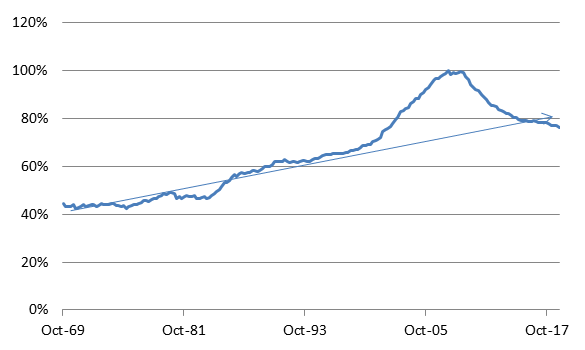
Source: Federal Reserve, BEA
The reading of 76.3% in the first quarter of this year is the lowest since 2002, well before the 2000s debt binge reached a fever pitch. In fact, as Exhibit 3 shows, the measure has fallen below a gently upward-sloping trend line going back 50 years. If anything, it would appear that the pendulum has swung beyond equilibrium in response to the excesses of the 2000s, putting household balance sheets in excellent shape in the aggregate.
Home owners’ equity
The Financial Accounts breakdown on the household balance sheet includes one other metric that offers interesting perspective. The Fed reports owners’ equity as a percentage of total real estate holdings, essentially the inverse of an aggregate LTV measure. The historical series shows that households’ real estate position took a much wilder round trip during the housing boom/bust than the recent stock market action, but has finally returned to the pre-boom levels of around 60%. Indeed, the current reading is broadly in line with the figures recorded throughout the 1990s and into the early 2000s, before the debt-induced housing boom took off.
Exhibit 4: Household owners’ equity as a percentage of real estate holdings
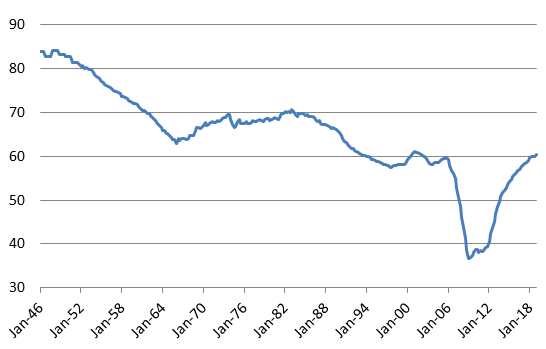
Source: Federal Reserve
Conclusion
Household balance sheets were quite damaged by the debt binge undertaken in the 2000s. It took a number of years after the Crisis for them to heal, but as we examine the landscape in 2019, household balance sheets are in an unusually strong position, especially for this stage of the business cycle. If the economy turns down, as many market participants have begun to anticipate, it will certainly not be because the consumer is overextended.
This material is intended only for institutional investors and does not carry all of the independence and disclosure standards of retail debt research reports. In the preparation of this material, the author may have consulted or otherwise discussed the matters referenced herein with one or more of SCM’s trading desks, any of which may have accumulated or otherwise taken a position, long or short, in any of the financial instruments discussed in or related to this material. Further, SCM may act as a market maker or principal dealer and may have proprietary interests that differ or conflict with the recipient hereof, in connection with any financial instrument discussed in or related to this material.
This message, including any attachments or links contained herein, is subject to important disclaimers, conditions, and disclosures regarding Electronic Communications, which you can find at https://portfolio-strategy.apsec.com/sancap-disclaimers-and-disclosures.
Important Disclaimers
Copyright © 2026 Santander US Capital Markets LLC and its affiliates (“SCM”). All rights reserved. SCM is a member of FINRA and SIPC. This material is intended for limited distribution to institutions only and is not publicly available. Any unauthorized use or disclosure is prohibited.
In making this material available, SCM (i) is not providing any advice to the recipient, including, without limitation, any advice as to investment, legal, accounting, tax and financial matters, (ii) is not acting as an advisor or fiduciary in respect of the recipient, (iii) is not making any predictions or projections and (iv) intends that any recipient to which SCM has provided this material is an “institutional investor” (as defined under applicable law and regulation, including FINRA Rule 4512 and that this material will not be disseminated, in whole or part, to any third party by the recipient.
The author of this material is an economist, desk strategist or trader. In the preparation of this material, the author may have consulted or otherwise discussed the matters referenced herein with one or more of SCM’s trading desks, any of which may have accumulated or otherwise taken a position, long or short, in any of the financial instruments discussed in or related to this material. Further, SCM or any of its affiliates may act as a market maker or principal dealer and may have proprietary interests that differ or conflict with the recipient hereof, in connection with any financial instrument discussed in or related to this material.
This material (i) has been prepared for information purposes only and does not constitute a solicitation or an offer to buy or sell any securities, related investments or other financial instruments, (ii) is neither research, a “research report” as commonly understood under the securities laws and regulations promulgated thereunder nor the product of a research department, (iii) or parts thereof may have been obtained from various sources, the reliability of which has not been verified and cannot be guaranteed by SCM, (iv) should not be reproduced or disclosed to any other person, without SCM’s prior consent and (v) is not intended for distribution in any jurisdiction in which its distribution would be prohibited.
In connection with this material, SCM (i) makes no representation or warranties as to the appropriateness or reliance for use in any transaction or as to the permissibility or legality of any financial instrument in any jurisdiction, (ii) believes the information in this material to be reliable, has not independently verified such information and makes no representation, express or implied, with regard to the accuracy or completeness of such information, (iii) accepts no responsibility or liability as to any reliance placed, or investment decision made, on the basis of such information by the recipient and (iv) does not undertake, and disclaims any duty to undertake, to update or to revise the information contained in this material.
Unless otherwise stated, the views, opinions, forecasts, valuations, or estimates contained in this material are those solely of the author, as of the date of publication of this material, and are subject to change without notice. The recipient of this material should make an independent evaluation of this information and make such other investigations as the recipient considers necessary (including obtaining independent financial advice), before transacting in any financial market or instrument discussed in or related to this material.
Important disclaimers for clients in the EU and UK
This publication has been prepared by Trading Desk Strategists within the Sales and Trading functions of Santander US Capital Markets LLC (“SanCap”), the US registered broker-dealer of Santander Corporate & Investment Banking. This communication is distributed in the EEA by Banco Santander S.A., a credit institution registered in Spain and authorised and regulated by the Bank of Spain and the CNMV. Any EEA recipient of this communication that would like to affect any transaction in any security or issuer discussed herein should do so with Banco Santander S.A. or any of its affiliates (together “Santander”). This communication has been distributed in the UK by Banco Santander, S.A.’s London branch, authorised by the Bank of Spain and subject to regulatory oversight on certain matters by the Financial Conduct Authority (FCA) and the Prudential Regulation Authority (PRA).
The publication is intended for exclusive use for Professional Clients and Eligible Counterparties as defined by MiFID II and is not intended for use by retail customers or for any persons or entities in any jurisdictions or country where such distribution or use would be contrary to local law or regulation.
This material is not a product of Santander´s Research Team and does not constitute independent investment research. This is a marketing communication and may contain ¨investment recommendations¨ as defined by the Market Abuse Regulation 596/2014 ("MAR"). This publication has not been prepared in accordance with legal requirements designed to promote the independence of research and is not subject to any prohibition on dealing ahead of the dissemination of investment research. The author, date and time of the production of this publication are as indicated herein.
This publication does not constitute investment advice and may not be relied upon to form an investment decision, nor should it be construed as any offer to sell or issue or invitation to purchase, acquire or subscribe for any instruments referred herein. The publication has been prepared in good faith and based on information Santander considers reliable as of the date of publication, but Santander does not guarantee or represent, express or implied, that such information is accurate or complete. All estimates, forecasts and opinions are current as at the date of this publication and are subject to change without notice. Unless otherwise indicated, Santander does not intend to update this publication. The views and commentary in this publication may not be objective or independent of the interests of the Trading and Sales functions of Santander, who may be active participants in the markets, investments or strategies referred to herein and/or may receive compensation from investment banking and non-investment banking services from entities mentioned herein. Santander may trade as principal, make a market or hold positions in instruments (or related derivatives) and/or hold financial interest in entities discussed herein. Santander may provide market commentary or trading strategies to other clients or engage in transactions which may differ from views expressed herein. Santander may have acted upon the contents of this publication prior to you having received it.
This publication is intended for the exclusive use of the recipient and must not be reproduced, redistributed or transmitted, in whole or in part, without Santander’s consent. The recipient agrees to keep confidential at all times information contained herein.


