


Uncategorized
Estimating secondary CLO debt spreads under stress
admin | June 14, 2019
This material is a Marketing Communication and does not constitute Independent Investment Research.
Investors with CLOs and other credits in total return portfolios often find spreads matter much more to performance than fundamental cash flow over short horizons. Some CLO investors have started focusing on potential CLO widening if the economy softens, and experience offers some clues. Drawing on lessons from the 2015-2016 oil bust and stressing a few representative deals, today’s CLOs would likely widen significantly depending on CLO loan quality and structure. In particular:
- Market value overcollateralization or MVOC would decline across all classes, driving up effective leverage sharply in the lowest rated classes
- Spreads would likely widen modestly in the highest rated classes but 700 bp to more than 1000 bp in the lowest rated classes
- Structure—the amount of subordination and the size of the classes—helps limit differences in spread widening across CLOs with different quality collateral
This quick study leaves plenty of room to strengthen the approach and broaden the application, but it takes a big step toward quantifying relative CLO spread risk under stress.
Choosing a stress scenario
The CLO market has seen a handful of stress episodes over time but few that come with good information on both loan pricing and debt spreads (Exhibit 1). As the internet bubble deflated from mid-1998 through 2002, managers reported pricing for only a minority of loans and the market left scarce records of secondary debt spreads. During the financial crisis, which marks the most severe stress, a sizable share of loans still went without reported pricing and secondary spreads again remain sparse. By the time of the oil bust from mid-2015 to early 2016 and the Fed scare in late 2018, however, the market had pricing on more than 99% of loans and had good benchmarks for secondary spreads. That makes the oil bust a good case study for CLO secondary performance under stress.
Exhibit 1: Stress episodes in CLOs
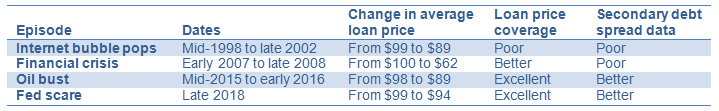
Source: S&P/LSTA, Amherst Pierpont Securities
A path to CLO pricing under stress
Investors should be able to estimate secondary CLO debt spreads under stress with a few steps:
- Estimate stress change in a CLO’s loan portfolio price and market value
- Estimate the shift in MVOC for each CLO class, and
- Use MVOC to estimate the new spread where the class might trade
A simple approach to leverage loan pricing under stress
One of the simplest models of leveraged loan pricing under stress uses the average price change within a loan rating category during a given episode. Rating, on average, should capture broad information about the quality of the borrowers’ balance sheets and expectations for their businesses. The average price change in a rating category then applies to loans in that category today.
The approach has some blind spots, of course. In particular, it misses the effects of some company specifics and the causes of stress in a given episode. A company’s industry should make a difference. During the oil bust, for instance, energy companies came under more stress than others. Even then, not all companies within an industry are the same. Energy companies surely went into the oil bust with different amounts of leverage, for example. The price change for a rating category could be biased in any one episode. Energy companies may have started the oil bust disproportionately in some rating categories rather than others, and using the oil bust could overstate the price sensitivity of the category to other stress scenarios. A model that accounted for borrower industry, borrower risks and sources of credit stress across episodes could limit some of these weaknesses. But a simple model using only rating should still offer a reasonable first estimate.
The average leveraged loan price from May 1, 2015, to February 20, 2016, dropped from $97.55 to $89.31 (Exhibit 2). The analysis categorized each loan outstanding through the period based on the lowest rating among major rating agencies. Sometimes the identical loan appeared in more than one CLO with different ratings; in those cases the analysis used the rating of the largest loan. Within a rating category, the analysis weighted price changes by the total principal outstanding for a given loan across all CLOs on May 1, 2015. Only loans with a price on both dates went into the analysis.
Exhibit 2: Leveraged loan prices declined significantly during the oil bust
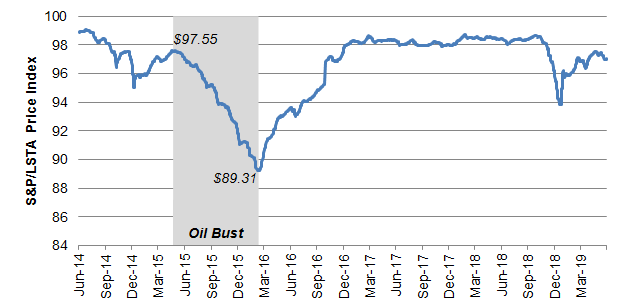
Source: S&P/LSTA, Bloomberg, Amherst Pierpont Securities
The analysis shows that market value during the oil bust shifted by small amounts in the few strongest loans but dropped by 20% to 40% in the weakest (Exhibit 3). For the 29 loans rated ‘BBB-‘ on May 1, 2015, for instance, the weighted average price dropped $0.67 and market value fell 0.67%. For the 96 loans rated ‘BB+’, the weighted average price dropped $1.13 and market value slipped 1.13%. But in the 286 loans rated ‘CCC’, the average price tumbled $16.07 and market value dropped 16.54%.
Exhibit 3: Leveraged loan price change by rating category during the oil bust
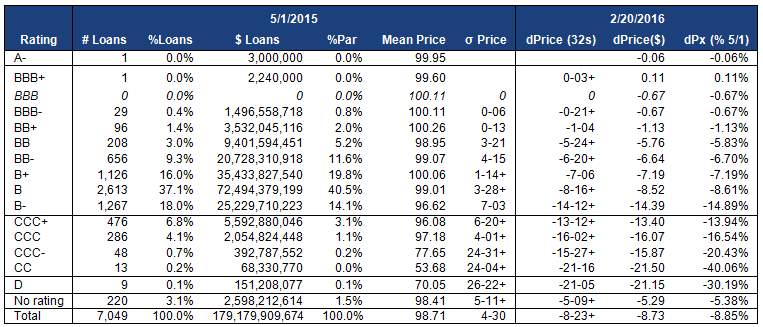
Note: Analysis includes only leveraged loans in BSL CLOs with prices on both May 1, 2015, and February 20, 2016. Ratings based on lowest rating from Intex. If the same loan appears in different CLO deals with different ratings, the rating on the modal amount of principal applies. Price changes within a rating category weighted by loan principal outstanding across all CLOs on May 1, 2015. Source: Intex, Amherst Pierpont Securities
Estimating a shift in portfolio market value
Estimating the market value impact on a CLO today if it were to go through an oil bust involves weighting the percentage market value change during the bust by the share of a CLO’s loans in each rating category. Even though oil hit energy companies hard during the bust, this approach assumes some other stress similarly hits today’s leveraged borrowers to the same effect.
Using a selection of CLOs with different mixes of loan ratings highlights the potential for market value in some CLOs to get hit harder than others (Exhibit 4). NEUB 2018-30, with the lowest share of ‘B-‘ loans and the lowest share of any ‘CCC’ rating, for instance, declines by 7.93%. ANCH 2013-1, with a larger share of loans in ‘B-‘ and in any ‘CCC’ category, declines by 8.66%. ZAIS 2014-2, with an even larger share in ‘B-‘ and in any ‘CCC’ category, declines by 9.00%.
Exhibit 4: Differences in loan mix drives projected market value decline
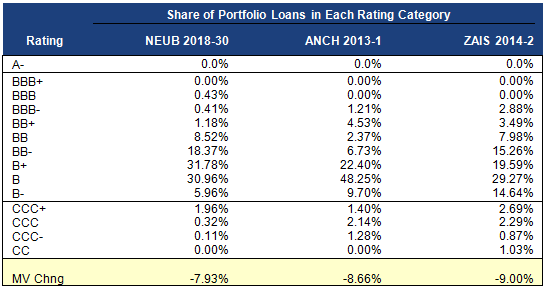
Note: Market value change estimated by weighting the share of portfolio loans in each category by the percentage price decline in each category from Exhibit 3, dPx (% 5/1). Source: Intex, Amherst Pierpont Securities.
The change in portfolio market value flows through each deal into MVOC and leverage for each class (Exhibit 5). The NEUB 2018-30 A1 class, for example, starts with an MVOC of 165 and ends with 151 for a change of 13.05 points. MVOC also translates into leverage. The same class starts with asset leverage of 2.55x and ends with 2.94x.Leverage isn’t easy to interpret once MVOC drops below 100 and a class effectively becomes equity. Classes with MVOC below 100 drop out of the analysis.
Absolute change in MVOC is highest for the most highly rated classes while leverage changes the most for the lowest rated classes. Leverage in the lowest classes goes up exponentially as MVOC approaches 100. After all, with MVOC at 100, a deal no longer has any market value equity and is infinitely leveraged. NEUB 2018-1 D starts with leverage of 9.22x and ends with 31.52x. The explosive rise in leverage as MVOC approaches 100 drives a similar widening in spreads.
Exhibit 5: Falling loan market value drives MVOC down and leverage up
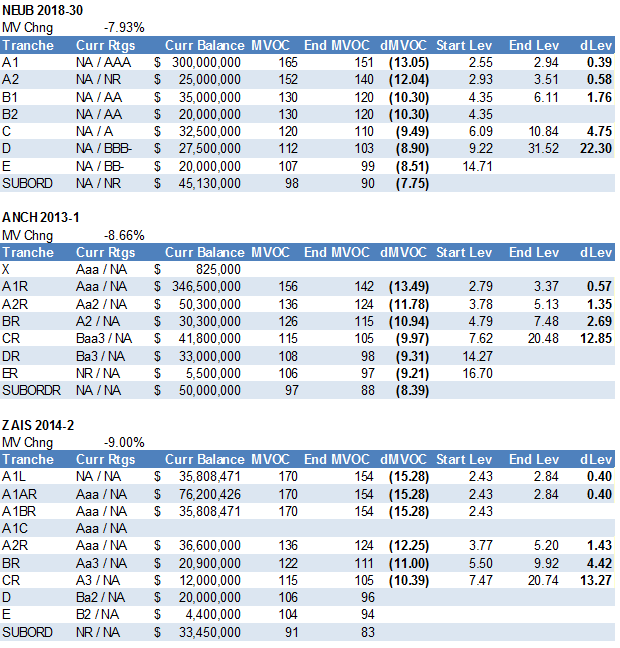
Source: Intex, Amherst Pierpont Securities
From leverage to spread
Secondary market spreads on CLO debt vary significantly with MVOC or leverage, but the spread per turn of leverage tends to be relatively stable across the classes of a deal and over time. Starting with NEUB 2018-30 again, the spread per turn of leverage across classes ranges between 40 bp and 49 bp with the exception of the A2 at 56 bp (Exhibit 6). With ANCH 2013-1, spread per turn of leverage ranges between 48 bp and 53 bp with the exception of the ER at 58 bp. With ZAIS 2014-2, spread per turn of leverage varies between 51 bp and 60 bp. The analysis assumes that as MVOC falls in the stress scenario and leverage rises, spread per turn of leverage moves smoothly along a curve determined within each deal. The final estimated spread for each class is just the ending leverage multiplied by estimated spread per turn of leverage.
Exhibit 6: Ending leverage and spread-per-turn-of-leverage drive spreads
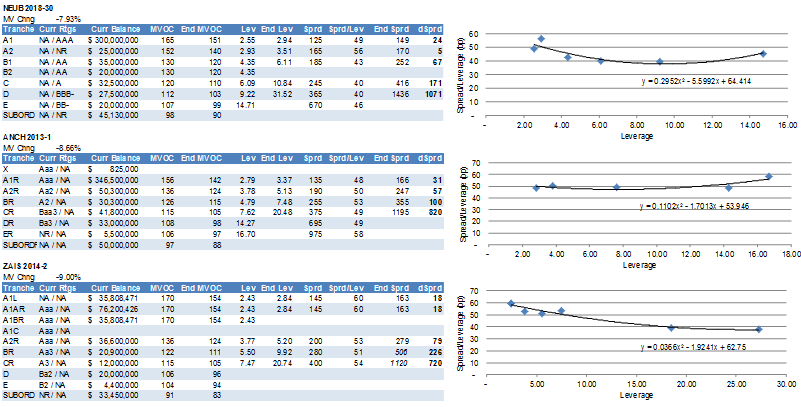
Note: Because spread-per-turn-of-leverage declines as leverage rises for ZAIS 2014-2,the analysis used starting spread-per-turn-of-leverage instead of interpolated to calculate final nominal spread for the BR and CR classes. Source: Intex, Amherst Pierpont Securities
In the final analysis
Simulating the impact of an oil bust scenario on a few representative CLOs shows ‘AAA’ or equivalent classes with initial MVOC of 156 to 170 widening modestly between 18 bp and 31 bp. ‘AA’ or equivalent classes with initial MVOC between 130 and 136 would widen between 60 bp and 80 bp. ‘AA-/A’ classes with initial MVOC between 120 and 126 would widen between 100 bp and 226 bp. And classes with initial MVOC between 105 and 112 would widen between 720 bp and 1071 bp.
The projected widening of spreads does not track directly with the initial quality of the CLO loan portfolio. Even though NEUB 2018-30 has the smallest projected decline in collateral market value and ZAIS 2014-2 has the largest, projected change in secondary spread does not follow the same order. CLO structure clearly buffers some of the collateral risk.
What may be more useful than the estimated absolute spread change on a class of CLO debt is the spread change relative to other similar classes in other CLOs. There’s plenty of room to improve estimates of absolute spread, but relative results usually are more reliable. Even a simple framework like the one outlined here should be useful for identifying CLOs today most likely to trade relatively well if the market finds itself under stress again.