Uncategorized
Not a refi wave. Yet.
admin | June 7, 2019
This material is a Marketing Communication and does not constitute Independent Investment Research.
Mortgage rates have fallen significantly over the last few weeks after falling steadily since October, fueling new concern about a pick-up in refinancing. Much of the mortgage market nevertheless carries note rates that still leave the refinancing incentive out-of-the-money, limiting the risk of a broad prepayment spike unless rates drop sharply. The exceptions are newer loans, which generally have higher note rates, are easier to refinance and could see some refi heat. Specified pools meanwhile have priced to rich levels with the exception of investor pools, which look like inexpensive options on lower rates.
Rates aren’t low enough for most borrowers to refinance
The primary mortgage rate currently stands at 3.82% according to the most recent Freddie Mac primary mortgage market survey. But this is only low enough to push 31% of the market more than 75 bp in-the-money to refinance (Exhibit 1). This is enough to push speeds over the course of a year on the average 30-year MBS to 13 CPR. Of course, seasonality will push actual speeds faster in the summer months and slower in the winter months.
Exhibit 1: Most 30-year mortgages are not in-the-money
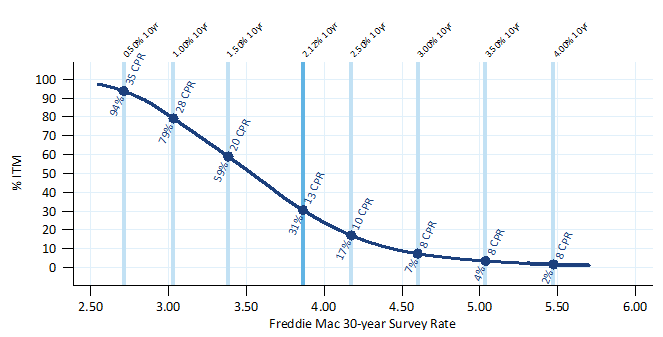
Note: the y-axis shows the percentage of the MBS universe that is at least 75 bp in-the-money, and the average expected prepayment speed is printed at various points along the curve. The speeds printed represent an average level over the course of a year; seasonality will push actual speeds faster in the summer months and slower in the winter months. Source: Amherst Pierpont Securities.
It would take substantially lower rates to push prepayment speeds back to the 30 CPR area last seen in 2012 and 2013. Primary mortgage rates would need to drop to roughly 3.0%, which would likely take a 1.0% 10-year Treasury rate.
The spread between primary and secondary mortgage rates also tends to buffer the impact of broad drops in interest rates. Primary/secondary spreads often widen as interest rates rally, which also helps reduce the effect of lower rates on mortgages. The primary/secondary spread is calculated by comparing each Thursday’s Freddie Mac primary market survey release to the mortgage current coupon posted from Monday through Wednesday, which corresponds to the survey period. Primary/secondary spreads had averaged roughly 80 bp to 85 bp in April and early May but have already jumped to 95 bp with the most recent rally.
The refi index has hardly moved
The MBA refinance index also suggests that rates are not low enough to trigger a huge refinance wave. The index has not reacted much to the recent rally (Exhibit 2). In fact, the index was much higher when rates dipped in late March.
Exhibit 2: MBA refinance index
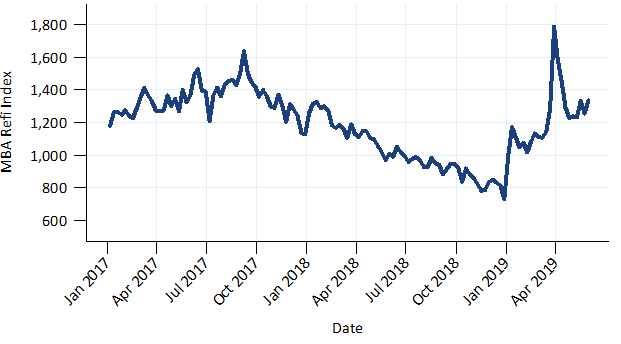
Source: MBA, Bloomberg, Amherst Pierpont Securities
But certain cohorts are exposed to faster speeds
At current mortgage rates the loans most likely to refinance have note rates of at least 4.5%. This means most cohorts with coupons 3.5% or lower shouldn’t be too sensitive to lower rates. However, starting in late 2018 originators have been delivering loans into much lower coupons than typical, raising the gross WAC of new production cohorts. For example the 2019 vintage 3.5%s have a substantially higher gross WAC than normal, 4.54%. This is similar to with the gross WAC of a typical 4.0% cohort of earlier vintages. A substantial number of loans in that cohort and other 4.0% cohorts, as well as loans in higher coupons, should prepay much faster.
Recently originated loans can refinance very rapidly once they are at least six months seasoned. These borrowers tend to have an easy time providing documentation since they recently closed on the existing loan, and appraisals can often be reused if they aren’t too old. Therefore 2018 and 2019 vintage cohorts could react more rapidly than older vintages. Jumbo loans, and in Ginnie Mae pools VA loans, also tend to react quickly to lower rates. Jumbo borrowers can save more money by refinancing and VA borrowers have a good streamline refinance program available.
Low quality pools have driven pay-ups higher
The higher gross WAC pools created by originators will dominate the TBA deliverable for some time, since these pools prepay much worse than a pool with the same coupon but a lower gross WAC. This has suppressed prices for the TBA, which has pushed pay-ups for specified pools to extremely rich levels (Exhibit 3).
Exhibit 3: Most payups are extremely high
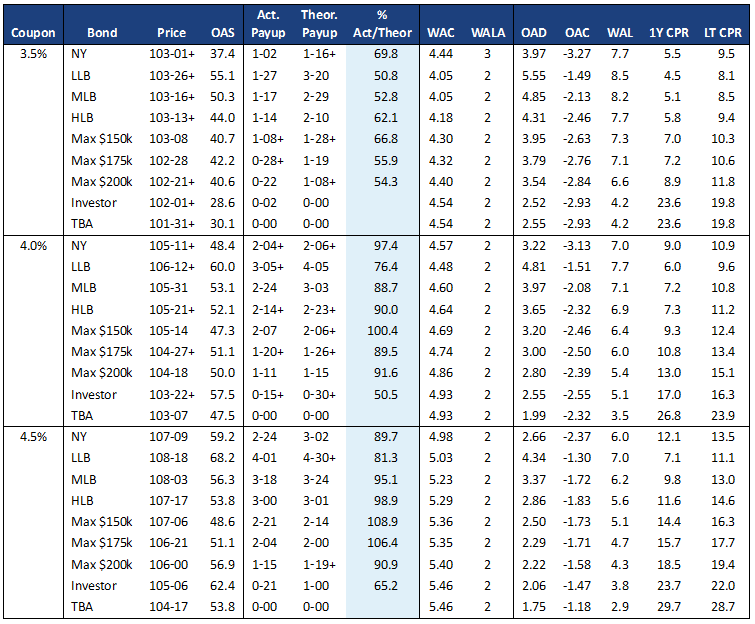
Note: calculation of the ratio of actual to theoretical pay-ups uses the April Fannie Mae major pool in each coupon to represent TBA. Source: Yield Book, Amherst Pierpont Securities
Many investors look at the ratio of actual pay-up to the theoretical pay-up calculated using a prepayment model. Each bond is run to the same OAS as that coupon’s TBA. Analysis using Yield Book’s TBA assumptions have not been adjusted to account for the higher gross WACs of 2019 pools. Therefore April issued Fannie major pools were used as a proxy for the TBA.
Even after benchmarking specified against major pools, the most inexpensive stories are trading at roughly 50% of theoretical value. Traditionally, most investors consider anything over 40% of theoretical to be too rich, so nothing looks very compelling.
One interesting exception is 30-year 3.5% investor loans, which trade only a few 32s above TBA. Pools of 30-year 4.0% investor loans trade $0-15+ above TBA, and pools of 4.5% investor loans trade $0-21 above TBA. That effectively gives the investor an option on falling rates: if rates rise the investor delivers the pool into TBA and loses the initial pay-up, but if rates fall the pay-up rises substantially.
Price compression across the stack presents an opportunity
However, the worsening of TBA prices has also compressed prices across the coupon stack, and this presents an opportunity to look at specified pools a little differently. Specified pools naturally have a longer duration than their TBA since they prepay more slowly. Since the TBA is worsening this difference is even greater, making it much more difficult to hedge spec pools with the same coupon TBA. Instead, investors should consider hedging with a lower coupon TBA, which naturally has a longer duration.
Typically one downside is that using a lower coupon hedge is more costly since the dollar price of the hedge is lower. But the coupon stack has compressed substantially this year. For example, the price difference between 3.5%s and 3.0%s compressed to $1-20+ from $2-12+ earlier this year. This makes it more feasible to hedge with a lower coupon.
For example, consider hedging a 3.5% Max $175,000 pool. Exhibit 4 shows analytics for Yield Book’s TBA assumption as well as a more realistic view of what the worst to deliver collateral will look like.
Exhibit 4: TBA comparison
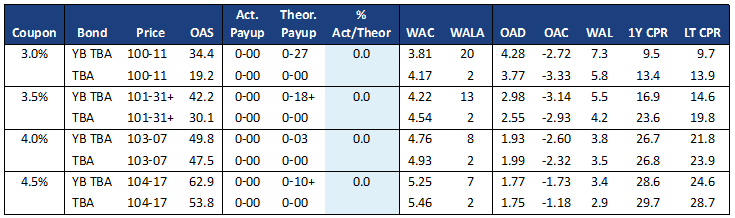
Source: YieldBook, Amherst Pierpont Securities
The Max $175,000 pool has a duration of 3.79 years (Exhibit 3) while the 3.0% TBA has a duration of 3.77 years, for a 1.0 hedge ratio. A market-value neutral hedge will therefore be pretty close to duration neutral. However, the hedge ratio to the 3.5% TBA is roughly 1.5, meaning that a market-value neutral hedge will have significant exposure to rate moves. Compared to hedging with the same-coupon TBA, the investor benefits from the additional carry from hedging with a lower coupon TBA. The investor also stands to benefit if the stack widens back to more typical levels.
This material is intended only for institutional investors and does not carry all of the independence and disclosure standards of retail debt research reports. In the preparation of this material, the author may have consulted or otherwise discussed the matters referenced herein with one or more of SCM’s trading desks, any of which may have accumulated or otherwise taken a position, long or short, in any of the financial instruments discussed in or related to this material. Further, SCM may act as a market maker or principal dealer and may have proprietary interests that differ or conflict with the recipient hereof, in connection with any financial instrument discussed in or related to this material.
This message, including any attachments or links contained herein, is subject to important disclaimers, conditions, and disclosures regarding Electronic Communications, which you can find at https://portfolio-strategy.apsec.com/sancap-disclaimers-and-disclosures.
Important Disclaimers
Copyright © 2026 Santander US Capital Markets LLC and its affiliates (“SCM”). All rights reserved. SCM is a member of FINRA and SIPC. This material is intended for limited distribution to institutions only and is not publicly available. Any unauthorized use or disclosure is prohibited.
In making this material available, SCM (i) is not providing any advice to the recipient, including, without limitation, any advice as to investment, legal, accounting, tax and financial matters, (ii) is not acting as an advisor or fiduciary in respect of the recipient, (iii) is not making any predictions or projections and (iv) intends that any recipient to which SCM has provided this material is an “institutional investor” (as defined under applicable law and regulation, including FINRA Rule 4512 and that this material will not be disseminated, in whole or part, to any third party by the recipient.
The author of this material is an economist, desk strategist or trader. In the preparation of this material, the author may have consulted or otherwise discussed the matters referenced herein with one or more of SCM’s trading desks, any of which may have accumulated or otherwise taken a position, long or short, in any of the financial instruments discussed in or related to this material. Further, SCM or any of its affiliates may act as a market maker or principal dealer and may have proprietary interests that differ or conflict with the recipient hereof, in connection with any financial instrument discussed in or related to this material.
This material (i) has been prepared for information purposes only and does not constitute a solicitation or an offer to buy or sell any securities, related investments or other financial instruments, (ii) is neither research, a “research report” as commonly understood under the securities laws and regulations promulgated thereunder nor the product of a research department, (iii) or parts thereof may have been obtained from various sources, the reliability of which has not been verified and cannot be guaranteed by SCM, (iv) should not be reproduced or disclosed to any other person, without SCM’s prior consent and (v) is not intended for distribution in any jurisdiction in which its distribution would be prohibited.
In connection with this material, SCM (i) makes no representation or warranties as to the appropriateness or reliance for use in any transaction or as to the permissibility or legality of any financial instrument in any jurisdiction, (ii) believes the information in this material to be reliable, has not independently verified such information and makes no representation, express or implied, with regard to the accuracy or completeness of such information, (iii) accepts no responsibility or liability as to any reliance placed, or investment decision made, on the basis of such information by the recipient and (iv) does not undertake, and disclaims any duty to undertake, to update or to revise the information contained in this material.
Unless otherwise stated, the views, opinions, forecasts, valuations, or estimates contained in this material are those solely of the author, as of the date of publication of this material, and are subject to change without notice. The recipient of this material should make an independent evaluation of this information and make such other investigations as the recipient considers necessary (including obtaining independent financial advice), before transacting in any financial market or instrument discussed in or related to this material.
Important disclaimers for clients in the EU and UK
This publication has been prepared by Trading Desk Strategists within the Sales and Trading functions of Santander US Capital Markets LLC (“SanCap”), the US registered broker-dealer of Santander Corporate & Investment Banking. This communication is distributed in the EEA by Banco Santander S.A., a credit institution registered in Spain and authorised and regulated by the Bank of Spain and the CNMV. Any EEA recipient of this communication that would like to affect any transaction in any security or issuer discussed herein should do so with Banco Santander S.A. or any of its affiliates (together “Santander”). This communication has been distributed in the UK by Banco Santander, S.A.’s London branch, authorised by the Bank of Spain and subject to regulatory oversight on certain matters by the Financial Conduct Authority (FCA) and the Prudential Regulation Authority (PRA).
The publication is intended for exclusive use for Professional Clients and Eligible Counterparties as defined by MiFID II and is not intended for use by retail customers or for any persons or entities in any jurisdictions or country where such distribution or use would be contrary to local law or regulation.
This material is not a product of Santander´s Research Team and does not constitute independent investment research. This is a marketing communication and may contain ¨investment recommendations¨ as defined by the Market Abuse Regulation 596/2014 ("MAR"). This publication has not been prepared in accordance with legal requirements designed to promote the independence of research and is not subject to any prohibition on dealing ahead of the dissemination of investment research. The author, date and time of the production of this publication are as indicated herein.
This publication does not constitute investment advice and may not be relied upon to form an investment decision, nor should it be construed as any offer to sell or issue or invitation to purchase, acquire or subscribe for any instruments referred herein. The publication has been prepared in good faith and based on information Santander considers reliable as of the date of publication, but Santander does not guarantee or represent, express or implied, that such information is accurate or complete. All estimates, forecasts and opinions are current as at the date of this publication and are subject to change without notice. Unless otherwise indicated, Santander does not intend to update this publication. The views and commentary in this publication may not be objective or independent of the interests of the Trading and Sales functions of Santander, who may be active participants in the markets, investments or strategies referred to herein and/or may receive compensation from investment banking and non-investment banking services from entities mentioned herein. Santander may trade as principal, make a market or hold positions in instruments (or related derivatives) and/or hold financial interest in entities discussed herein. Santander may provide market commentary or trading strategies to other clients or engage in transactions which may differ from views expressed herein. Santander may have acted upon the contents of this publication prior to you having received it.
This publication is intended for the exclusive use of the recipient and must not be reproduced, redistributed or transmitted, in whole or in part, without Santander’s consent. The recipient agrees to keep confidential at all times information contained herein.


