Uncategorized
A safe harbor in REITs amidst ‘BBB’ concerns
admin | May 31, 2019
This material is a Marketing Communication and does not constitute Independent Investment Research.
Concern about the ballooning size of the ‘BBB’ market and mounting systemic leverage among issuers has resurfaced repeatedly since corporate issuance started a relatively unimpeded tear in 2012. Recent fresh concerns about credit coincided with a reversal in high grade bond fund flows last week, which broke a 16-week streak of in-flows. Lipper recently reported that IG funds saw a $5.1 billion outflow – the largest single weekly reading since 2015. Amidst the general concern about ‘BBB’, there may be safer harbor in REITs.
Shifting spread compensation for ‘BBB’
The additional spread compensation available in ‘BBB’ over ‘A’ corporates is currently in the low 60 bp range compared to a cycle low closer to 40 bp (Exhibit 1). The pick-up available compared to ‘AA’ credit is closer to 90 bp, compared with a recent cycle low of about 60 bp touched in early 2018. On a longer-term basis the current spread levels are on the lower-end of the spectrum. But as recent market concerns have highlighted, ‘BBB’ now accounts for a much larger portion of the exceedingly larger IG USD corporate bond market, which would suggest that investors globally are being given little choice but to allocate a greater portion of holdings to lower-rated credit based on supply trends.
Exhibit 1: ‘BBB’ has widened recently to ‘A’ and ‘AA’
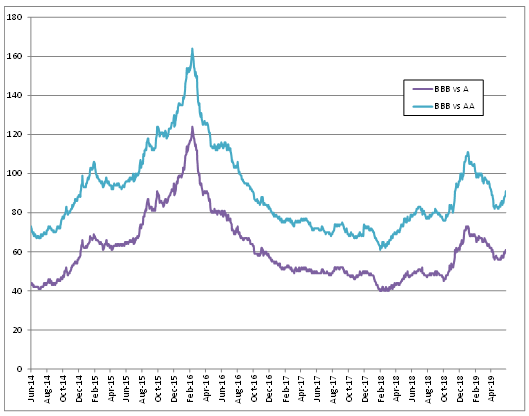
Source: Bloomberg Barclays US Corporate Indices
Possible safer harbor in REITs
As markets appear to be reaching an inflection point, IG investors are faced with the decision of whether to pare back their riskier holdings, or ride out what could be a more volatile road ahead, at least in the immediate term. One area we would highlight within this ‘BBB’ dilemma is REITs. Because of their structure and common use of higher leverage, operators within the REIT industry have traditionally managed their balance sheets to ‘BBB’ credit quality (mostly). This differs from other segments within the IG index, which have only more recently seen a ramp up in debt issuance and more constituents in the lower rating categories.
REITs have mostly market-performed YTD, producing excess returns of 2.61%, directly in line with 2.59% for the Broad Corporate Index as credit mostly improved throughout the first four months of the year. Comparatively, during the last back-up in credit, beginning the first week of October 2018 and peaking in early January, the IG Index blew out over 50 bp in relatively short order. During the sell-off, the REIT subgroup gave up just 1.74% in excess return compared with a loss of 3.38% for the Index, and double-digit weakness in some of the more sensitive credits within IG. In short, the sector has demonstrated greater stability during recent periods of market turbulence, despite a high concentration of ‘BBB’ issuers within the industry. Investors proved more comfortable carrying these risks versus other more cyclical industries.
Trade Idea in REITS: Corporate Office Properties (OFC) 2025s
OFC’s 2025 bonds (rated Baa3/BBB-) are offering value in this part of the curve over comps. The OFC 25s trade right on top of its closest office REIT peer comp, CXP 4.15 ‘25s. Though CXP is technically higher-rated at Baa2/BBB, the relative risk profiles between the two credits is perceived to be closer due to OFC’s more stable, primarily government and government-related tenant base, as well as its moderately larger size. Office REITs have performed relatively well year-to-date as suggested in the time series graph of the industry’s spread curve (Exhibit 2) – the one exception being OPI bonds, which are the levered outcome of the merger between GOV and SIR that closed earlier this year (combined rating Baa3/BBB-). The suburban office segment has been challenged over the past several years, amidst overcapacity in properties and higher occupancies. OFC’s higher occupancy and retention rates stand out over its closer peers.
Exhibit 2: OFC 25s vs BBB office REIT comps
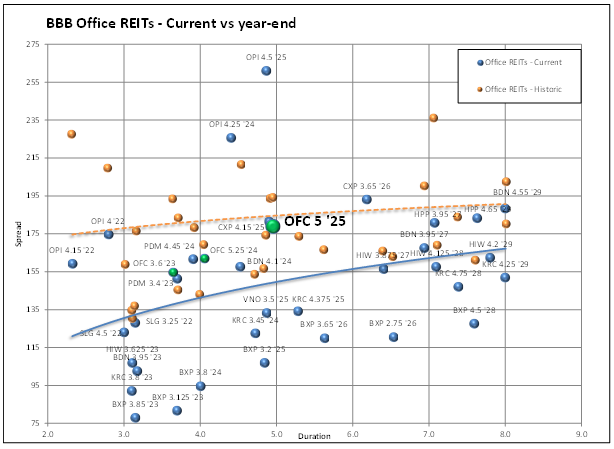
Source: Amherst Pierpont Securities, Bloomberg/TRACE G-spread indications
This material is intended only for institutional investors and does not carry all of the independence and disclosure standards of retail debt research reports. In the preparation of this material, the author may have consulted or otherwise discussed the matters referenced herein with one or more of SCM’s trading desks, any of which may have accumulated or otherwise taken a position, long or short, in any of the financial instruments discussed in or related to this material. Further, SCM may act as a market maker or principal dealer and may have proprietary interests that differ or conflict with the recipient hereof, in connection with any financial instrument discussed in or related to this material.
This message, including any attachments or links contained herein, is subject to important disclaimers, conditions, and disclosures regarding Electronic Communications, which you can find at https://portfolio-strategy.apsec.com/sancap-disclaimers-and-disclosures.
Important Disclaimers
Copyright © 2026 Santander US Capital Markets LLC and its affiliates (“SCM”). All rights reserved. SCM is a member of FINRA and SIPC. This material is intended for limited distribution to institutions only and is not publicly available. Any unauthorized use or disclosure is prohibited.
In making this material available, SCM (i) is not providing any advice to the recipient, including, without limitation, any advice as to investment, legal, accounting, tax and financial matters, (ii) is not acting as an advisor or fiduciary in respect of the recipient, (iii) is not making any predictions or projections and (iv) intends that any recipient to which SCM has provided this material is an “institutional investor” (as defined under applicable law and regulation, including FINRA Rule 4512 and that this material will not be disseminated, in whole or part, to any third party by the recipient.
The author of this material is an economist, desk strategist or trader. In the preparation of this material, the author may have consulted or otherwise discussed the matters referenced herein with one or more of SCM’s trading desks, any of which may have accumulated or otherwise taken a position, long or short, in any of the financial instruments discussed in or related to this material. Further, SCM or any of its affiliates may act as a market maker or principal dealer and may have proprietary interests that differ or conflict with the recipient hereof, in connection with any financial instrument discussed in or related to this material.
This material (i) has been prepared for information purposes only and does not constitute a solicitation or an offer to buy or sell any securities, related investments or other financial instruments, (ii) is neither research, a “research report” as commonly understood under the securities laws and regulations promulgated thereunder nor the product of a research department, (iii) or parts thereof may have been obtained from various sources, the reliability of which has not been verified and cannot be guaranteed by SCM, (iv) should not be reproduced or disclosed to any other person, without SCM’s prior consent and (v) is not intended for distribution in any jurisdiction in which its distribution would be prohibited.
In connection with this material, SCM (i) makes no representation or warranties as to the appropriateness or reliance for use in any transaction or as to the permissibility or legality of any financial instrument in any jurisdiction, (ii) believes the information in this material to be reliable, has not independently verified such information and makes no representation, express or implied, with regard to the accuracy or completeness of such information, (iii) accepts no responsibility or liability as to any reliance placed, or investment decision made, on the basis of such information by the recipient and (iv) does not undertake, and disclaims any duty to undertake, to update or to revise the information contained in this material.
Unless otherwise stated, the views, opinions, forecasts, valuations, or estimates contained in this material are those solely of the author, as of the date of publication of this material, and are subject to change without notice. The recipient of this material should make an independent evaluation of this information and make such other investigations as the recipient considers necessary (including obtaining independent financial advice), before transacting in any financial market or instrument discussed in or related to this material.
Important disclaimers for clients in the EU and UK
This publication has been prepared by Trading Desk Strategists within the Sales and Trading functions of Santander US Capital Markets LLC (“SanCap”), the US registered broker-dealer of Santander Corporate & Investment Banking. This communication is distributed in the EEA by Banco Santander S.A., a credit institution registered in Spain and authorised and regulated by the Bank of Spain and the CNMV. Any EEA recipient of this communication that would like to affect any transaction in any security or issuer discussed herein should do so with Banco Santander S.A. or any of its affiliates (together “Santander”). This communication has been distributed in the UK by Banco Santander, S.A.’s London branch, authorised by the Bank of Spain and subject to regulatory oversight on certain matters by the Financial Conduct Authority (FCA) and the Prudential Regulation Authority (PRA).
The publication is intended for exclusive use for Professional Clients and Eligible Counterparties as defined by MiFID II and is not intended for use by retail customers or for any persons or entities in any jurisdictions or country where such distribution or use would be contrary to local law or regulation.
This material is not a product of Santander´s Research Team and does not constitute independent investment research. This is a marketing communication and may contain ¨investment recommendations¨ as defined by the Market Abuse Regulation 596/2014 ("MAR"). This publication has not been prepared in accordance with legal requirements designed to promote the independence of research and is not subject to any prohibition on dealing ahead of the dissemination of investment research. The author, date and time of the production of this publication are as indicated herein.
This publication does not constitute investment advice and may not be relied upon to form an investment decision, nor should it be construed as any offer to sell or issue or invitation to purchase, acquire or subscribe for any instruments referred herein. The publication has been prepared in good faith and based on information Santander considers reliable as of the date of publication, but Santander does not guarantee or represent, express or implied, that such information is accurate or complete. All estimates, forecasts and opinions are current as at the date of this publication and are subject to change without notice. Unless otherwise indicated, Santander does not intend to update this publication. The views and commentary in this publication may not be objective or independent of the interests of the Trading and Sales functions of Santander, who may be active participants in the markets, investments or strategies referred to herein and/or may receive compensation from investment banking and non-investment banking services from entities mentioned herein. Santander may trade as principal, make a market or hold positions in instruments (or related derivatives) and/or hold financial interest in entities discussed herein. Santander may provide market commentary or trading strategies to other clients or engage in transactions which may differ from views expressed herein. Santander may have acted upon the contents of this publication prior to you having received it.
This publication is intended for the exclusive use of the recipient and must not be reproduced, redistributed or transmitted, in whole or in part, without Santander’s consent. The recipient agrees to keep confidential at all times information contained herein.


