Uncategorized
Economics: Tight housing market
admin | May 24, 2019
This material is a Marketing Communication and does not constitute Independent Investment Research.
Homebuilders since the housing bust of the late-2000s have operated as if once burned, twice shy. Housing starts and new home sales 10 years after the bust, are running far below even pre-boom levels. It took several years for housing demand to absorb the significant supply created during the boom, but evidence is accumulating that the housing market is getting tight, which should support strength in building activity going forward.
Housing stock arithmetic
The basic concept for thinking about the housing stock is that the number of housing units should roughly track the growth of the population, or, more precisely, the number of households, over time. Homes age or otherwise become uninhabitable, too, so new construction should modestly outpace the household growth to account for both population growth and turnover of the housing stock. Various metrics can provide insight into how the current situation compares on a historical basis.
Vacant units and occupancy rates
The Census Bureau reports each quarter on housing inventory, occupancy, home ownership rates and other aspects of housing. Estimates of housing inventory include a breakdown of units that are occupied versus those that are vacant, either year-round or seasonally. The number of vacant housing units fell sharply in 2017 and 2018 (Exhibit 1).
Exhibit 1: Vacant housing units
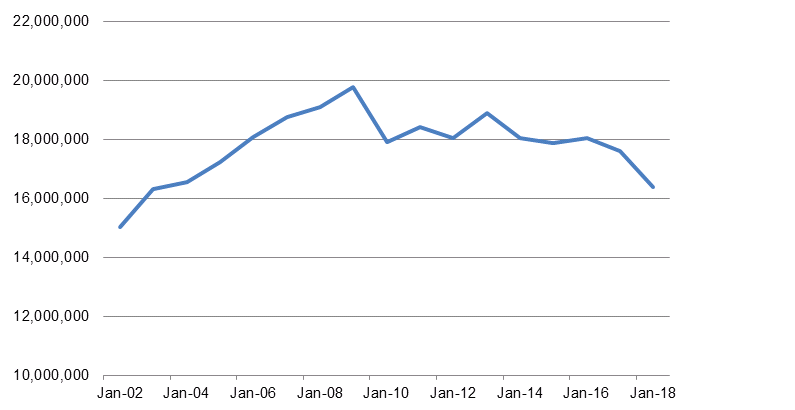
Source: Census Bureau.
The same data implies an occupancy rate—the percentage of housing units that are occupied year-round. This gauge similarly shows that the housing supply has tightened considerably over the past two years (Exhibit 2). In fact, the occupancy rate is the highest in nearly 20 years; this measure actually understates occupancy, since some vacant homes are vacation homes occupied only part of the year.
Exhibit 2: Housing occupancy rate
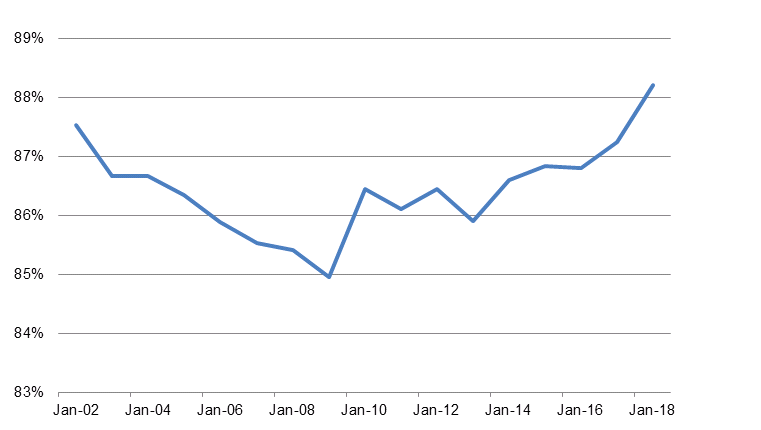
Source: Census Bureau.
Vacancy rates
The Census Bureau also separately calculates vacancy rates for homeowners and renters. These data show that the homeowner vacancy rate has fallen to levels last seen in the early 1980s after an unprecedented spike during the housing bust.
Exhibit 3: Homeowner vacancy rate
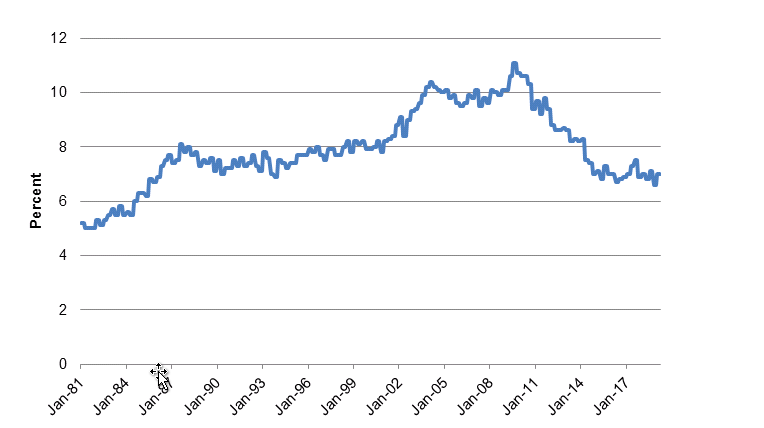
Source: Census Bureau.
Similarly, the rental vacancy rate has dropped to 1.4%, matching the lowest reading since 1981.
Exhibit 4: Rental vacancy rate
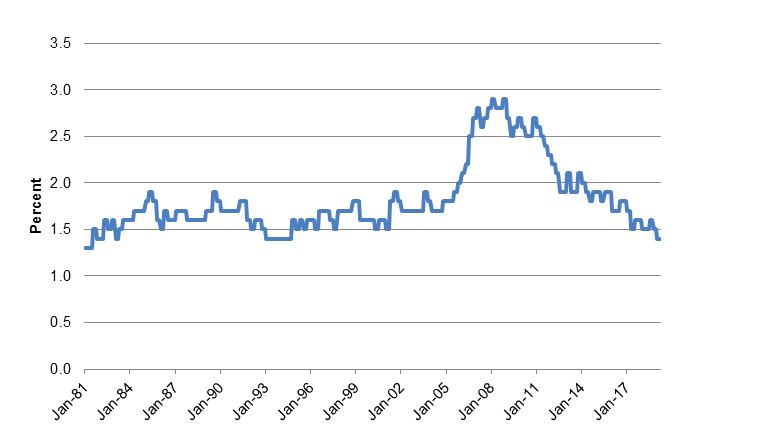
Source: Census Bureau.
Using occupied housing units as a proxy for household formation
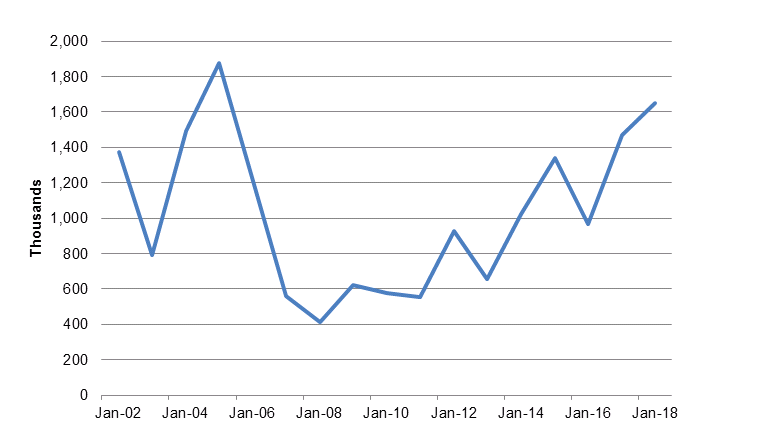
For the purposes of this discussion, a household” could be defined as a family, group, or individual (of any sort) that occupies its own housing unit. Thus, we can use the Census Bureau series on occupied housing units as a proxy for household formation (the Census Bureau definition of “number of households” does not quite conform to our housing-centric concept). Thus, the annual change in the number of occupied units is a somewhat choppy, but rough proxy for the increase in the number of households, or annual household formation. This gauge of household formation dropped sharply and persistently after the Great Recession, as families and friends doubled up due to the deterioration in household finances—the primary example being the stories of millennials living in their parents’ basements (Exhibit 5). With the economy growing robustly, household formation has risen sharply in the past few years.
Exhibit 5: Occupied housing units as a proxy for household formation
Source: Census Bureau.
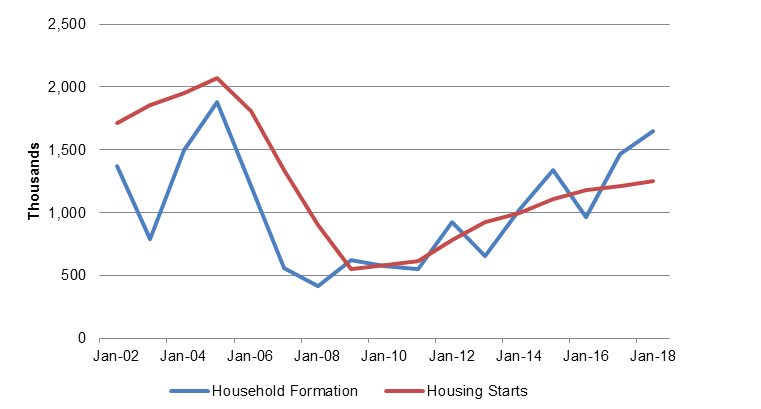
Armed with a proxy for household formation, we can now compare the pace of housing demand (household formation) with the growth of housing supply (as measured by housing starts). Housing starts outpaced household formation during the Housing Boom years, creating an inventory overhang (Exhibit 6). The two series recovered more or less in tandem through much of the Bust and subsequent recovery, which actually constitutes a period when housing inventories were slowly being pared (remember that there is a certain amount of turnover/destruction in the housing stock over time). However, in the last two years, the pace of household formation has surged while housing starts have failed to accelerate. This chart provides another independent confirmation that the supply of housing has tightened considerably over the past few years.
Exhibit 6: Household formation outstripping housing starts
Source: Census Bureau.
Implications
In a sense, the housing market can be thought of similarly to any goods market. When inventories accumulate, manufacturers tend to slow down the pace of production, and vice versa. In the case of the housing market, these data make a compelling case that housing starts will need to pick up going forward (unless demand deteriorates substantially). This supports my contention that the housing sector should begin to contribute positively to real GDP growth again soon after a string of five consecutive negative quarters.
A tight housing market also suggests that home prices are likely to remain firm. We have seen a significant moderation in home price appreciation recently after several years of unsustainably rapid gains. Some of the cooling reflects a general sense among potential buyers that homes had gotten too pricey, and some portion of the slowdown may be a one-off adjustment in high-end markets and high-tax states to the tax changes (SALT deduction and mortgage interest deduction limits). In any case, these data would suggest that home prices will not weaken very much or for very long as long as demand holds up.
Of course, home prices do not figure directly into key measures of consumer prices, but rent does. The tightness in rental markets, as indicated in Exhibit 4, is likely to keep shelter costs firm. Indeed, even as home price appreciation has cooled dramatically over the last few quarters, rent and owners’ equivalent rent have remained firm. In the CPI, rent has risen by 3.8% over the past 12 months, while OER has increased by 3.4%. In both cases, these gains are nearly identical to the corresponding 12-month advances through April 2017 and 2018, even though measures of home price appreciation have slipped from the past few years.
This material is intended only for institutional investors and does not carry all of the independence and disclosure standards of retail debt research reports. In the preparation of this material, the author may have consulted or otherwise discussed the matters referenced herein with one or more of SCM’s trading desks, any of which may have accumulated or otherwise taken a position, long or short, in any of the financial instruments discussed in or related to this material. Further, SCM may act as a market maker or principal dealer and may have proprietary interests that differ or conflict with the recipient hereof, in connection with any financial instrument discussed in or related to this material.
This message, including any attachments or links contained herein, is subject to important disclaimers, conditions, and disclosures regarding Electronic Communications, which you can find at https://portfolio-strategy.apsec.com/sancap-disclaimers-and-disclosures.
Important Disclaimers
Copyright © 2026 Santander US Capital Markets LLC and its affiliates (“SCM”). All rights reserved. SCM is a member of FINRA and SIPC. This material is intended for limited distribution to institutions only and is not publicly available. Any unauthorized use or disclosure is prohibited.
In making this material available, SCM (i) is not providing any advice to the recipient, including, without limitation, any advice as to investment, legal, accounting, tax and financial matters, (ii) is not acting as an advisor or fiduciary in respect of the recipient, (iii) is not making any predictions or projections and (iv) intends that any recipient to which SCM has provided this material is an “institutional investor” (as defined under applicable law and regulation, including FINRA Rule 4512 and that this material will not be disseminated, in whole or part, to any third party by the recipient.
The author of this material is an economist, desk strategist or trader. In the preparation of this material, the author may have consulted or otherwise discussed the matters referenced herein with one or more of SCM’s trading desks, any of which may have accumulated or otherwise taken a position, long or short, in any of the financial instruments discussed in or related to this material. Further, SCM or any of its affiliates may act as a market maker or principal dealer and may have proprietary interests that differ or conflict with the recipient hereof, in connection with any financial instrument discussed in or related to this material.
This material (i) has been prepared for information purposes only and does not constitute a solicitation or an offer to buy or sell any securities, related investments or other financial instruments, (ii) is neither research, a “research report” as commonly understood under the securities laws and regulations promulgated thereunder nor the product of a research department, (iii) or parts thereof may have been obtained from various sources, the reliability of which has not been verified and cannot be guaranteed by SCM, (iv) should not be reproduced or disclosed to any other person, without SCM’s prior consent and (v) is not intended for distribution in any jurisdiction in which its distribution would be prohibited.
In connection with this material, SCM (i) makes no representation or warranties as to the appropriateness or reliance for use in any transaction or as to the permissibility or legality of any financial instrument in any jurisdiction, (ii) believes the information in this material to be reliable, has not independently verified such information and makes no representation, express or implied, with regard to the accuracy or completeness of such information, (iii) accepts no responsibility or liability as to any reliance placed, or investment decision made, on the basis of such information by the recipient and (iv) does not undertake, and disclaims any duty to undertake, to update or to revise the information contained in this material.
Unless otherwise stated, the views, opinions, forecasts, valuations, or estimates contained in this material are those solely of the author, as of the date of publication of this material, and are subject to change without notice. The recipient of this material should make an independent evaluation of this information and make such other investigations as the recipient considers necessary (including obtaining independent financial advice), before transacting in any financial market or instrument discussed in or related to this material.
Important disclaimers for clients in the EU and UK
This publication has been prepared by Trading Desk Strategists within the Sales and Trading functions of Santander US Capital Markets LLC (“SanCap”), the US registered broker-dealer of Santander Corporate & Investment Banking. This communication is distributed in the EEA by Banco Santander S.A., a credit institution registered in Spain and authorised and regulated by the Bank of Spain and the CNMV. Any EEA recipient of this communication that would like to affect any transaction in any security or issuer discussed herein should do so with Banco Santander S.A. or any of its affiliates (together “Santander”). This communication has been distributed in the UK by Banco Santander, S.A.’s London branch, authorised by the Bank of Spain and subject to regulatory oversight on certain matters by the Financial Conduct Authority (FCA) and the Prudential Regulation Authority (PRA).
The publication is intended for exclusive use for Professional Clients and Eligible Counterparties as defined by MiFID II and is not intended for use by retail customers or for any persons or entities in any jurisdictions or country where such distribution or use would be contrary to local law or regulation.
This material is not a product of Santander´s Research Team and does not constitute independent investment research. This is a marketing communication and may contain ¨investment recommendations¨ as defined by the Market Abuse Regulation 596/2014 ("MAR"). This publication has not been prepared in accordance with legal requirements designed to promote the independence of research and is not subject to any prohibition on dealing ahead of the dissemination of investment research. The author, date and time of the production of this publication are as indicated herein.
This publication does not constitute investment advice and may not be relied upon to form an investment decision, nor should it be construed as any offer to sell or issue or invitation to purchase, acquire or subscribe for any instruments referred herein. The publication has been prepared in good faith and based on information Santander considers reliable as of the date of publication, but Santander does not guarantee or represent, express or implied, that such information is accurate or complete. All estimates, forecasts and opinions are current as at the date of this publication and are subject to change without notice. Unless otherwise indicated, Santander does not intend to update this publication. The views and commentary in this publication may not be objective or independent of the interests of the Trading and Sales functions of Santander, who may be active participants in the markets, investments or strategies referred to herein and/or may receive compensation from investment banking and non-investment banking services from entities mentioned herein. Santander may trade as principal, make a market or hold positions in instruments (or related derivatives) and/or hold financial interest in entities discussed herein. Santander may provide market commentary or trading strategies to other clients or engage in transactions which may differ from views expressed herein. Santander may have acted upon the contents of this publication prior to you having received it.
This publication is intended for the exclusive use of the recipient and must not be reproduced, redistributed or transmitted, in whole or in part, without Santander’s consent. The recipient agrees to keep confidential at all times information contained herein.


