Uncategorized
Corporate credit: A diamond, or more precisely, a Target in the rough
admin | May 24, 2019
This material is a Marketing Communication and does not constitute Independent Investment Research.
Target (TGT) credit looks like a good defensive play within the retail sector. The consistent same store sales performance coupled with operating margin growth despite higher costs improves the likelihood that management will be able to weather the impending tariff storm better than peers.
TGT outshines peers
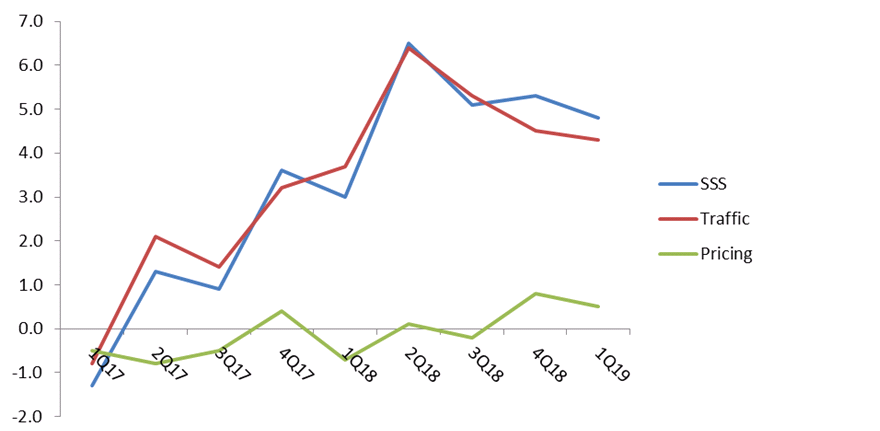
Following multiple earnings misses in the retail sector and downward revisions to guidance (KSS and LOW), TGT outshined its retail peers this week turning in a solid quarter underscored by strong same store sales and traffic growth. TGT posted its eightth consecutive quarter of positive sales (up 4.8%), which was largely driven by increases in traffic both in store and online. TGT has effectively improved its price perception and merchandise assortment through its private and exclusive offerings, which remains a good traffic driver. Online sales grew an impressive 42%, which was off of solid 28% growth in the year-ago period. Management noted that the digital sales growth contributed 2.1% to TGT’s overall sales growth for the quarter. Disciplined cost control led to operating income growth of 9% (to $1.14bn), translating to operating margin growth of 20bps yoy (to 6.4%). Management remains confident that they can deliver mid-single digit operating income growth for the full year.
Exhibit 1: Quarterly same store sales, traffic and pricing
 Source: Company Reports
Convenience and price
TGT’s investments in Omnichannel, particularly same day fulfillment, are paying off. Same day fulfillment services including: pickup in store, drive up and Shipt represented over half of the online growth for the quarter. That said, these three services drove more than a quarter of TGT’s total 1Q sales growth. Importantly, management noted that the new fulfilment services (drive up and Shipt) are leading to incremental customer trips given the added convenience. As these new fulfilment options take hold, it helps to save on shipping costs, thereby benefitting the gross margin.
Furthermore, TGT’s private and exclusive offerings continue to be successful and remain another important element of traffic growth. Not only have these brands improved price perception but they create merchandise offerings that can only be found at TGT. TGT has long been successful with designer collaborations and its most recent collaboration with Vineyard Vines may be its most successful to date. The collection included 300 items including apparel, accessories and swim for the entire family with the majority of items priced below $35. With that price point, the collection sold out almost instantly leaving only a handful of items left online.
Balance sheet remains solid
TGT ended the quarter with total debt/EBITDA of 1.9x and lease adjusted leverage of 2.1x, both down nearly 2 ticks sequentially. We note that TGT already refinanced its upcoming $1bn June debt maturity with its issuance in March. Therefore, leverage is set to decline further when that bond matures. TGT maintains a very manageable debt maturity profile after 2019 with $1.1bn due in 2020, $49mm due in 2021, $1.1bn due in 2022, nothing due in 2023 and $1.1bn due in 2024.
Current tariffs baked into guidance
Given the better than expected 1Q results, TGT reaffirmed full year guidance of a low-to-mid-single digit increase in SSS, mid-single digit growth in operating income and adjusted EPS in the $5.75-$6.05 range. Management noted that its current guidance includes existing tariff increases to 25% (expected to become effective in June), as they have plans in place to mitigate the impact of those increases. However, full year guidance does not include proposed increases on all imports and management indicated that further increases will likely lead to higher prices, echoing similar comments made by Walmart Inc. (WMT).
Relative value
TGT credit looks like a good defensive play within the retail sector. The consistent same store sales performance coupled with operating margin growth despite higher costs improves the likelihood that management will be able to weather the impending tariff storm better than peers. While higher tariffs will likely lead to higher prices, TGT has demonstrated over the past two quarters that increased prices did not come at the expense of sales growth. That looks like a function of TGT’s merchandise assortment, price perception and improved fulfillment capabilities. Furthermore, the strong balance sheet and real estate portfolio aids in credit quality. There’s value in the 10-year part of the TGT curve as TGT 3.375% 4/15/29 bonds are currently offered at 78 bp (79 g-spread) which is roughly 7 bp behind HD 3.9% 12/6/28 bonds. Note that in the 7-year part of the curve, TGT 2.5% 4/15/26 trade roughly 10 bp (g-spread) through HD 2.125% 9/15/26.
This material is intended only for institutional investors and does not carry all of the independence and disclosure standards of retail debt research reports. In the preparation of this material, the author may have consulted or otherwise discussed the matters referenced herein with one or more of SCM’s trading desks, any of which may have accumulated or otherwise taken a position, long or short, in any of the financial instruments discussed in or related to this material. Further, SCM may act as a market maker or principal dealer and may have proprietary interests that differ or conflict with the recipient hereof, in connection with any financial instrument discussed in or related to this material.
This message, including any attachments or links contained herein, is subject to important disclaimers, conditions, and disclosures regarding Electronic Communications, which you can find at https://portfolio-strategy.apsec.com/sancap-disclaimers-and-disclosures.
Important Disclaimers
Copyright © 2026 Santander US Capital Markets LLC and its affiliates (“SCM”). All rights reserved. SCM is a member of FINRA and SIPC. This material is intended for limited distribution to institutions only and is not publicly available. Any unauthorized use or disclosure is prohibited.
In making this material available, SCM (i) is not providing any advice to the recipient, including, without limitation, any advice as to investment, legal, accounting, tax and financial matters, (ii) is not acting as an advisor or fiduciary in respect of the recipient, (iii) is not making any predictions or projections and (iv) intends that any recipient to which SCM has provided this material is an “institutional investor” (as defined under applicable law and regulation, including FINRA Rule 4512 and that this material will not be disseminated, in whole or part, to any third party by the recipient.
The author of this material is an economist, desk strategist or trader. In the preparation of this material, the author may have consulted or otherwise discussed the matters referenced herein with one or more of SCM’s trading desks, any of which may have accumulated or otherwise taken a position, long or short, in any of the financial instruments discussed in or related to this material. Further, SCM or any of its affiliates may act as a market maker or principal dealer and may have proprietary interests that differ or conflict with the recipient hereof, in connection with any financial instrument discussed in or related to this material.
This material (i) has been prepared for information purposes only and does not constitute a solicitation or an offer to buy or sell any securities, related investments or other financial instruments, (ii) is neither research, a “research report” as commonly understood under the securities laws and regulations promulgated thereunder nor the product of a research department, (iii) or parts thereof may have been obtained from various sources, the reliability of which has not been verified and cannot be guaranteed by SCM, (iv) should not be reproduced or disclosed to any other person, without SCM’s prior consent and (v) is not intended for distribution in any jurisdiction in which its distribution would be prohibited.
In connection with this material, SCM (i) makes no representation or warranties as to the appropriateness or reliance for use in any transaction or as to the permissibility or legality of any financial instrument in any jurisdiction, (ii) believes the information in this material to be reliable, has not independently verified such information and makes no representation, express or implied, with regard to the accuracy or completeness of such information, (iii) accepts no responsibility or liability as to any reliance placed, or investment decision made, on the basis of such information by the recipient and (iv) does not undertake, and disclaims any duty to undertake, to update or to revise the information contained in this material.
Unless otherwise stated, the views, opinions, forecasts, valuations, or estimates contained in this material are those solely of the author, as of the date of publication of this material, and are subject to change without notice. The recipient of this material should make an independent evaluation of this information and make such other investigations as the recipient considers necessary (including obtaining independent financial advice), before transacting in any financial market or instrument discussed in or related to this material.
Important disclaimers for clients in the EU and UK
This publication has been prepared by Trading Desk Strategists within the Sales and Trading functions of Santander US Capital Markets LLC (“SanCap”), the US registered broker-dealer of Santander Corporate & Investment Banking. This communication is distributed in the EEA by Banco Santander S.A., a credit institution registered in Spain and authorised and regulated by the Bank of Spain and the CNMV. Any EEA recipient of this communication that would like to affect any transaction in any security or issuer discussed herein should do so with Banco Santander S.A. or any of its affiliates (together “Santander”). This communication has been distributed in the UK by Banco Santander, S.A.’s London branch, authorised by the Bank of Spain and subject to regulatory oversight on certain matters by the Financial Conduct Authority (FCA) and the Prudential Regulation Authority (PRA).
The publication is intended for exclusive use for Professional Clients and Eligible Counterparties as defined by MiFID II and is not intended for use by retail customers or for any persons or entities in any jurisdictions or country where such distribution or use would be contrary to local law or regulation.
This material is not a product of Santander´s Research Team and does not constitute independent investment research. This is a marketing communication and may contain ¨investment recommendations¨ as defined by the Market Abuse Regulation 596/2014 ("MAR"). This publication has not been prepared in accordance with legal requirements designed to promote the independence of research and is not subject to any prohibition on dealing ahead of the dissemination of investment research. The author, date and time of the production of this publication are as indicated herein.
This publication does not constitute investment advice and may not be relied upon to form an investment decision, nor should it be construed as any offer to sell or issue or invitation to purchase, acquire or subscribe for any instruments referred herein. The publication has been prepared in good faith and based on information Santander considers reliable as of the date of publication, but Santander does not guarantee or represent, express or implied, that such information is accurate or complete. All estimates, forecasts and opinions are current as at the date of this publication and are subject to change without notice. Unless otherwise indicated, Santander does not intend to update this publication. The views and commentary in this publication may not be objective or independent of the interests of the Trading and Sales functions of Santander, who may be active participants in the markets, investments or strategies referred to herein and/or may receive compensation from investment banking and non-investment banking services from entities mentioned herein. Santander may trade as principal, make a market or hold positions in instruments (or related derivatives) and/or hold financial interest in entities discussed herein. Santander may provide market commentary or trading strategies to other clients or engage in transactions which may differ from views expressed herein. Santander may have acted upon the contents of this publication prior to you having received it.
This publication is intended for the exclusive use of the recipient and must not be reproduced, redistributed or transmitted, in whole or in part, without Santander’s consent. The recipient agrees to keep confidential at all times information contained herein.


