


Uncategorized
Rates, spreads and trade war
admin | May 17, 2019
This material is a Marketing Communication and does not constitute Independent Investment Research.
The latest salvo in a US-China trade war has added some new risk premium to US fixed income. Rates have dropped, the yield curve steepened, and spreads on credit and MBS have widened. Whether this salvo is the latest or just the next of many, the risk premium should linger. But the premium should not be equal across the market. While overall risk to US growth looks modest, some industries and some local markets are more vulnerable to trade war than others.
Implications for rates
Growth in the US and China becomes vulnerable under almost any scenario where tariffs or other policies hit US-China trade, but as my colleague Stephen Stanley also points out, the magnitude is modest. The US imported $540 billion in merchandise from China in 2018 and exported $120 billion. Trade in services was smaller. The US bought an estimated $17 billion in services and sold an estimated $58 billion. In a $21 trillion US economy, these are modest amounts. In China’s $14 trillion economy, the impact is a little larger.
The US rates markets so far have reacted as if implications for growth are very limited. The current 55 bp yield on 10-year TIPS is unchanged from the start of May, implying no change in expected real growth. It also implies paltry US growth regardless of trade frictions, but that’s a topic for another day. The lack of any change almost certainly underestimates risk, but the risk to the US from trade generally is modest. A 2010 San Fran Fed study estimated US consumers spent 88.5% of their money on domestically sourced goods and services. Since then, the absolute size of the US trade deficit has generally tracked GDP, so the domestic share of the US consumer wallet is likely about the same. The outsized domestic focus of US GDP insulates it from trade.
US rates markets, however, have to pay attention to the broader impact of US-China trade war since some countries—Japan, Korea and other Pacific Rim countries especially—are highly sensitive to trade flows. For example, the share of total US manufactured imports in 1990 coming from Pacific Rim countries was 47.1% and in 2017, according to the Congressional Research Service was still 47.1%. China’s share of those Pacific Rim imports over that period, however, rose from 7.6% to 55.4%. China had absorbed a large part of Pacific Rim production. Tariffs on China’s manufactured goods could turn that process around and push production back out to the Pacific Rim. The current uncertainty about the direction of US-China trade could generate flight-to-quality flows from Pacific Rim investors and investors in other countries with businesses leveraged to trade flow.
Implications for credit
For credit, risk to US-China trade varies across industry, geography and company. The risk across industry falls most clearly on corporate credit and across geography most clearly on structured credit. The debt of issuers sensitive to trade flows should carry a new risk premium, as should structured products secured by residential or commercial real estate exposures or consumer or business debt concentrated in states and cities closely tied to global trade.
Across products
The most direct impact likely falls on US companies with significant exports to China. Except possibly for the most specialized products, the higher cost of exporting to China clearly makes those producers less competitive in China. But the potential loss of business in China also makes those producers less competitive worldwide if size and scale drops and marginal costs rise. In 2017, aerospace manufacturers topped the list of US exporters to China followed by farmers, motor vehicle manufacturers, makers of semiconductors and electronic components and producers of oil and gas (Exhibit 1).
Exhibit 1: Top 10 US exports to China in 2017
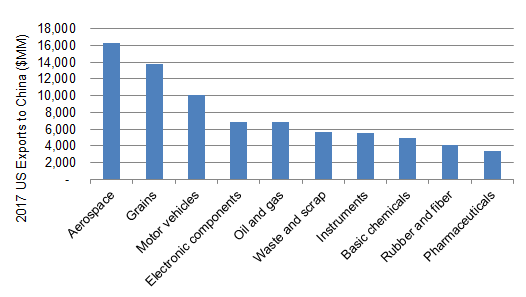
Source: US Commerce Department
An indirect impact of tariffs also falls on US importers from China. The higher price for selling these products in the US clearly makes them less competitive in the US. But if these products are inputs to other final goods made in the US, then the US goods are also less competitive both in the US and worldwide. This also puts pressure on size and scale and potentially raises marginal cost. Companies buying communications equipment headed the list in 2017, followed by buyers of computers, commodities, clothing and semiconductors and other components (Exhibit 2).
Exhibit 2: Top 10 US imports from China in 2017
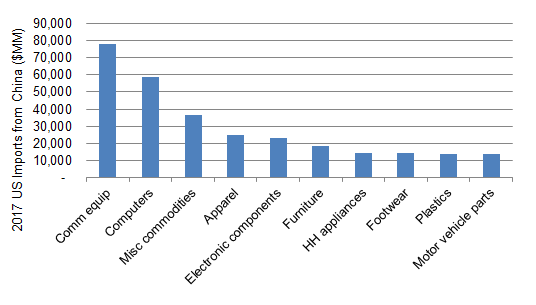
Source: US Commerce Department
Across the map
US-China trade flows also fall unevenly across the US map, and that potentially matters for local housing and consumer credit as well as local business and commercial real estate. US exports to China in 2018 as a percent of state GDP came primarily from states with heavy concentrations in aerospace and agriculture (Exhibit 3). Washington (2.78%), South Carolina (2.41%), Oregon (1.96%), Alaska (1.86%) and Alabama (1.36%) headed the list.
Imports from China in 2018 ended up in a slightly different mix of states (Exhibit 3). Heavy imports of electronic components for cellphones, printers and computers led Tennessee (7.12%) to top the list followed by California (5.34% ), Illinois (4.65%), Arkansas (3.98%) and Georgia (3.94%). The likely impact of tariffs on products flowing to those states and cities should be slower and less obvious than the impact of exports on local US markets. But higher production costs open the door to competition from imports from countries not subject to tariffs.
Exhibit 3: Merchandise trade with China in 2018 as a percent of state GDP
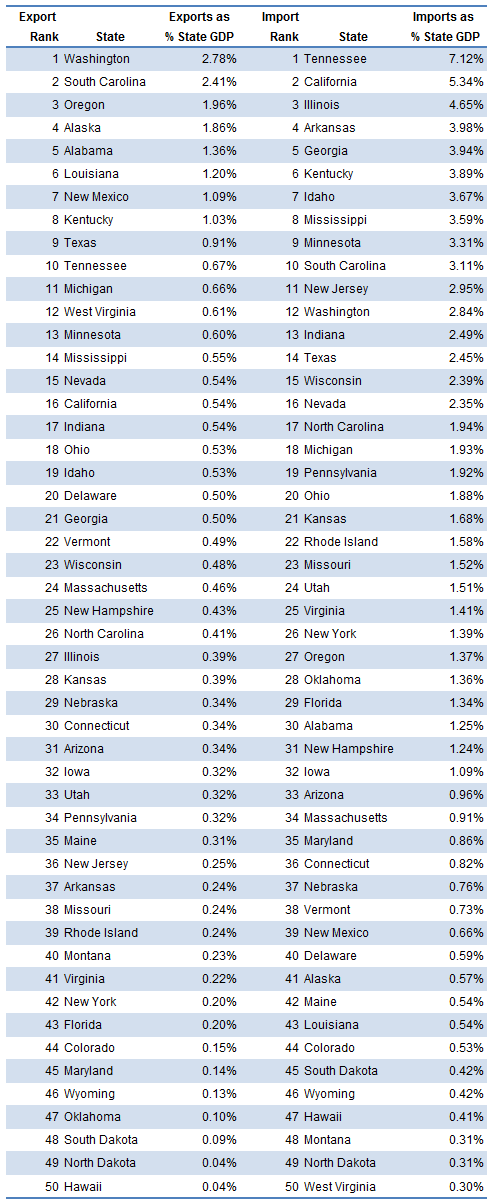
Source: US Department of Commerce, Bureau of Economic Analysis, Amherst Pierpont Securities
The case for a persistent risk premium
For spectators in the market, the tangle of issues between the two countries looks long and complex and unlikely to get resolved quickly or conclusively. A 2016 report to Congress from the US Trade Representative identified a list of nontrivial issues:
- Intellectual property rights including trade secrets, patents, rights to software and counterfeit goods
- Industrial policies that give companies owned or controlled by national or local government proprietary access or advantage
- Limits on services such as electronic payments, film and entertainment, insurance, delivery and legal services
- Limits on agricultural products
- Transparency in publishing trade-related laws, regulations and notice and comment periods
- Legal frameworks for administrative licenses and China’s competition policy
These issues reflect the long history of trade between the two countries and the choices that each party has made along the way. It seems reasonable to expect the willingness of the US and China to contest these issues to regularly rise and fall.
The use of tariffs in the US-China negotiation also builds a constituency for broader use. Some industries, companies and local markets will benefit. Others will find themselves vulnerable to imports from countries free of tariffs and may want to level the playing field.
The global consensus on trade is clearly shifting, and the fixed income markets will have to watch and wait and reprice.
* * *
The view in rates
Concerns about low inflation have started weighing on Treasury yields, and recent remarks by Fed Governor Lael Brainard indicate concerns about low inflation at the Fed, too. Explanations for low inflation vary, but the Fed seems to be appropriately focused on inflation expectations and ways to keep them anchored around 2%. Lately breakeven 10-year inflation has dropped to 183 bp but still is above the 168 bp that started the year. Renewed discord over trade and higher tariffs on Chinese goods has continued to keep rates low, and the market now puts the probability of a Fed cut by December at nearly 75%. The likely fundamentals of long-run growth should push 10-year rates a little higher, but unless a new trade agreement is brokered, expect the fair value level of 2.75% to remain out of reach.
The view in spreads
Spreads in investment grade debt have widened 10 bp as trade frictions picked up through May with high yield wider by 35 bp. It’s an appropriate repricing. Over the longer term, a relatively flat yield curve, low volatility and heavy net supply of Treasury debt should re-tighten spread markets, but the timing will depend on trade as well. The longer the Fed remains patient, the longer the spread advantage in assets other than Treasury debt compound to the advantage of portfolio return. Leverage and loosening of underwriting remain a concern in investment grade corporate debt and leveraged loans, but concerns about recession, which would trigger those vulnerabilities, have diminished. Agency MBS could see a softening of bank demand, but it should still outperform credit.
The view in credit
Companies have started to divert cash flow toward paying down debt, have started to sell non-core assets and have curtailed stock buybacks. Management has heard the concerns of debt investors. Households continue to look strong with low unemployment, rising home prices, and generally good performance in investment portfolios.