Uncategorized
GDP arithmetic
admin | May 10, 2019
This material is a Marketing Communication and does not constitute Independent Investment Research.
The arithmetic for translating monthly readings of various components of GDP to quarterly averages is rather simple, but it is not necessarily transparent. Choppy monthly results for consumer spending since last fall have led to substantial volatility in the quarterly averages. A quick tutorial on how the quarterly real consumer spending figures relate to the monthly data helps explain the soft first quarter results, and why the market should expect a robust acceleration in the spring.
December ruins Q1
Even though anecdotal reports on Christmas retails sales were mostly robust, both the Census Bureau retail sales and the BEA consumer spending results for December were disastrous. In real terms, consumer expenditures according to these numbers fell by 0.6% in December, the largest monthly drop since 2009. While the December hiccup helped to drag down the Q4 average, outlier results for the last month of a calendar quarter usually do the most damage to the next quarter.
The dip in December outlays brought the level at the end of the year well below the Q4 average (Exhibit 1). As a result, consumer spending spent much of the first quarter digging out of the hole created by the gap between the Q4 average and the low December level—a gap of almost $40 billion. A solid bounceback in consumer expenditures in January (+0.4% in real terms) barely brought the level of spending back up to the Q4 average. As the chart shows, if not for the explosive gain in March, real consumer spending would have barely grown at all in Q1, even though the January (+0.4%) and February (flat) moves averaged out to a trend-like +0.2% per month, which is a 2.4% annualized pace. The tremendous gain in March managed to boost Q1 to a still-anemic 1.2% annualized rise, slightly less than half of the pace registered in 2017 and 2018. Thus, in some sense, Q1’s fate for consumer spending was all but sealed in December, before the quarter even started.
Exhibit 1: Real Consumer Spending
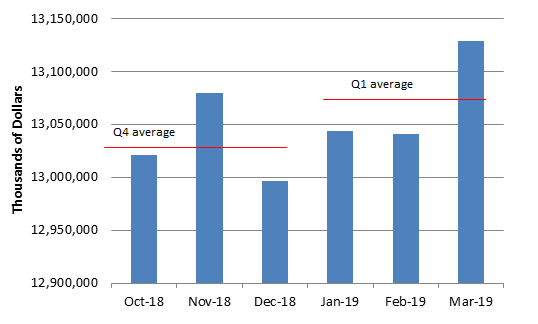
Source: BEA.
March boosts Q2
The same arithmetic that doomed Q1 is going to boost the Q2 average considerably. As Exhibit 1 shows, the explosive rise in real consumer outlays in March pushed the level of spending at the end of the first quarter sharply above the quarterly average (by almost $60 billion). If real consumer expenditures were absolutely flat from the March level for April, May, and June, the Q2 average would still work out to an annualized gain of 1.8%, not great but only modestly shy of the underlying trend (and better than the Q1 result!).
More realistically, if spending in April, May, and June each grow by, say, 0.2% per month, the Q2 average would work out to a 3.4% annualized increase. My very preliminary forecast for Q2 is slightly more optimistic, assuming monthly increases of 0.25% per month, a 3% annualized clip, not much different than the 2017 and 2018 performances (2.7% and 2.6% respectively), and produces a quarterly annualized advance of 3.8%.
Consensus estimates too conservative
At this point, many readers are probably thinking that this arithmetic is ridiculously simple and should be obvious to everyone. Perhaps, but it clearly is not. The latest Bloomberg economist survey released just a few days ago calls for real consumer spending to post a gain of only 2.8% in Q2, which implies that the consensus forecast for average monthly gains over the April to June period is barely above 0.1%. This is probably the primary reason why my Q2 GDP forecast (2.8% as of this writing) is far above the consensus forecast of 2.0% (from the same Bloomberg survey).
You would think that economists would be wise to the routine by now. The March/Q2 pattern should be familiar. Last year, real consumer spending surged by 0.6% in real terms in March, which set the stage for a robust bounceback quarter (3.8% annualized in Q2, up from a rise of only 0.5% annualized in Q1). However, in the same Bloomberg survey from a year ago (i.e. as of early May), the consensus for Q2 consumer spending was 2.9%, nearly a full percentage point shy of the eventual result. Similarly, in March 2017, consumer spending in real terms surged by 0.7%, yet again setting the stage for a strong Q2 (in that case, by May, economists’ forecasts roughly matched the eventual Q2 result for consumption). Likewise, in 2014 and 2015, above-trend gains in March real consumer outlays laid the groundwork for explosive Q2 advances that exceeded the consensus forecast as of early May.
Thus, while it may seem foolhardy to have a far above-consensus call for real consumer spending and, in turn, GDP growth for Q2 before we have any hard data for the three months of the actual calendar quarter, that is a limb out onto I will gladly shimmy.
This material is intended only for institutional investors and does not carry all of the independence and disclosure standards of retail debt research reports. In the preparation of this material, the author may have consulted or otherwise discussed the matters referenced herein with one or more of SCM’s trading desks, any of which may have accumulated or otherwise taken a position, long or short, in any of the financial instruments discussed in or related to this material. Further, SCM may act as a market maker or principal dealer and may have proprietary interests that differ or conflict with the recipient hereof, in connection with any financial instrument discussed in or related to this material.
This message, including any attachments or links contained herein, is subject to important disclaimers, conditions, and disclosures regarding Electronic Communications, which you can find at https://portfolio-strategy.apsec.com/sancap-disclaimers-and-disclosures.
Important Disclaimers
Copyright © 2026 Santander US Capital Markets LLC and its affiliates (“SCM”). All rights reserved. SCM is a member of FINRA and SIPC. This material is intended for limited distribution to institutions only and is not publicly available. Any unauthorized use or disclosure is prohibited.
In making this material available, SCM (i) is not providing any advice to the recipient, including, without limitation, any advice as to investment, legal, accounting, tax and financial matters, (ii) is not acting as an advisor or fiduciary in respect of the recipient, (iii) is not making any predictions or projections and (iv) intends that any recipient to which SCM has provided this material is an “institutional investor” (as defined under applicable law and regulation, including FINRA Rule 4512 and that this material will not be disseminated, in whole or part, to any third party by the recipient.
The author of this material is an economist, desk strategist or trader. In the preparation of this material, the author may have consulted or otherwise discussed the matters referenced herein with one or more of SCM’s trading desks, any of which may have accumulated or otherwise taken a position, long or short, in any of the financial instruments discussed in or related to this material. Further, SCM or any of its affiliates may act as a market maker or principal dealer and may have proprietary interests that differ or conflict with the recipient hereof, in connection with any financial instrument discussed in or related to this material.
This material (i) has been prepared for information purposes only and does not constitute a solicitation or an offer to buy or sell any securities, related investments or other financial instruments, (ii) is neither research, a “research report” as commonly understood under the securities laws and regulations promulgated thereunder nor the product of a research department, (iii) or parts thereof may have been obtained from various sources, the reliability of which has not been verified and cannot be guaranteed by SCM, (iv) should not be reproduced or disclosed to any other person, without SCM’s prior consent and (v) is not intended for distribution in any jurisdiction in which its distribution would be prohibited.
In connection with this material, SCM (i) makes no representation or warranties as to the appropriateness or reliance for use in any transaction or as to the permissibility or legality of any financial instrument in any jurisdiction, (ii) believes the information in this material to be reliable, has not independently verified such information and makes no representation, express or implied, with regard to the accuracy or completeness of such information, (iii) accepts no responsibility or liability as to any reliance placed, or investment decision made, on the basis of such information by the recipient and (iv) does not undertake, and disclaims any duty to undertake, to update or to revise the information contained in this material.
Unless otherwise stated, the views, opinions, forecasts, valuations, or estimates contained in this material are those solely of the author, as of the date of publication of this material, and are subject to change without notice. The recipient of this material should make an independent evaluation of this information and make such other investigations as the recipient considers necessary (including obtaining independent financial advice), before transacting in any financial market or instrument discussed in or related to this material.
Important disclaimers for clients in the EU and UK
This publication has been prepared by Trading Desk Strategists within the Sales and Trading functions of Santander US Capital Markets LLC (“SanCap”), the US registered broker-dealer of Santander Corporate & Investment Banking. This communication is distributed in the EEA by Banco Santander S.A., a credit institution registered in Spain and authorised and regulated by the Bank of Spain and the CNMV. Any EEA recipient of this communication that would like to affect any transaction in any security or issuer discussed herein should do so with Banco Santander S.A. or any of its affiliates (together “Santander”). This communication has been distributed in the UK by Banco Santander, S.A.’s London branch, authorised by the Bank of Spain and subject to regulatory oversight on certain matters by the Financial Conduct Authority (FCA) and the Prudential Regulation Authority (PRA).
The publication is intended for exclusive use for Professional Clients and Eligible Counterparties as defined by MiFID II and is not intended for use by retail customers or for any persons or entities in any jurisdictions or country where such distribution or use would be contrary to local law or regulation.
This material is not a product of Santander´s Research Team and does not constitute independent investment research. This is a marketing communication and may contain ¨investment recommendations¨ as defined by the Market Abuse Regulation 596/2014 ("MAR"). This publication has not been prepared in accordance with legal requirements designed to promote the independence of research and is not subject to any prohibition on dealing ahead of the dissemination of investment research. The author, date and time of the production of this publication are as indicated herein.
This publication does not constitute investment advice and may not be relied upon to form an investment decision, nor should it be construed as any offer to sell or issue or invitation to purchase, acquire or subscribe for any instruments referred herein. The publication has been prepared in good faith and based on information Santander considers reliable as of the date of publication, but Santander does not guarantee or represent, express or implied, that such information is accurate or complete. All estimates, forecasts and opinions are current as at the date of this publication and are subject to change without notice. Unless otherwise indicated, Santander does not intend to update this publication. The views and commentary in this publication may not be objective or independent of the interests of the Trading and Sales functions of Santander, who may be active participants in the markets, investments or strategies referred to herein and/or may receive compensation from investment banking and non-investment banking services from entities mentioned herein. Santander may trade as principal, make a market or hold positions in instruments (or related derivatives) and/or hold financial interest in entities discussed herein. Santander may provide market commentary or trading strategies to other clients or engage in transactions which may differ from views expressed herein. Santander may have acted upon the contents of this publication prior to you having received it.
This publication is intended for the exclusive use of the recipient and must not be reproduced, redistributed or transmitted, in whole or in part, without Santander’s consent. The recipient agrees to keep confidential at all times information contained herein.


