Uncategorized
April speeds surprise to the high side
admin | May 10, 2019
This material is a Marketing Communication and does not constitute Independent Investment Research.
MBS prepayment speeds surged past expectations in April as Fannie Mae 30-year speeds increased 25.7% to 11.2 CPR from 9.0 CPR and Freddie Mac speeds jumped 31.2% to 11.4 CPR from 8.8 CPR. Ginnie Mae II speeds followed suit, increasing 26.3% to 14.6 CPR from 11.7 CPR. Day count was unchanged and seasonal turnover doesn’t tend to increase much from March to April, yet discount speeds still jumped 20% or more. Lagged rates were roughly 13 bp lower, which pushed speeds up even faster. Newer vintages increased the most, in both conventionals and Ginnies.
There was a short, but deep, rate rally in late March. Likely many newer borrowers were able to take advantage of this short window of low rates and close their refinances in April. The average rate is deceptive since rates were not low for very long.
Exhibit 1: Prepayment speeds jumped across the stack in April
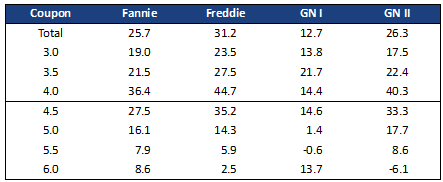
Note: % change in 30-year prepayment speeds from March 2019 to April 2019. Source: Fannie Mae, Freddie Mac, Ginnie Mae, eMBS, 1010data, Amherst Pierpont Securities
Low WAC and low loan balance pools provided prepayment protection
GSE pools with lower gross WACs generally prepaid much better than those with higher WACs. For example, many pools issued in December 2018 had very high WAC-to-coupon spreads. Fannie Mae 30-year 3.5% pools with more than 80 bp of spread prepaid at 10.5 CPR compared to 1.5 CPR for those with less than 80 bp of spread. Similarly, high spread 30-year 4.0%s prepaid at 17.3 CPR with lower spread pools at 11.8 CPR.
Low loan balance pools prepaid well even if the pools had higher WACs. For example, HLB 30-year 4.0% pools issued in December with spreads greater than 80 bp only prepaid at 4.1 CPR in April. Pay-ups remain very high for specified pools, at least in part due higher gross WAC pool production driving down the quality of the TBA deliverable, but the collateral does perform better.
New pool production should improve when UMBS goes live, since the GSEs will cap both WAC or coupon spread and the amount of servicing that can be retained. New UMBS pools should outperform the TBA, and pay-ups for low WALA pools could move higher.
The largest increases came in newer vintages
Recent vintage conventional pools performed especially badly, as many of these pools have very high spreads between the weighted average coupons (WACs) of the loans and the pool’s coupon. But even newer Ginnie pools prepaid much faster in April, and these pools don’t have high spreads. For example, Ginnie II 4.0%s 2018 increased 67.9% compared to a 73.3% increase in the same coupon Fannie MBS. Meanwhile the 2017 vintages increased 39.1% and 27.1% at Ginnie and Fannie, respectively.
Freddie pools prepay faster than Fannie MBS in April
Freddie speeds increased more than Fannie MBS, which is not something market participants wanted to see one month before the introduction of the UMBS. However the cohort-level speed differences remain well within the thresholds established by the FHFA. For example, the Fannie Mae 4.0% cohort prepaid at 13.1 CPR and the Freddie Mac cohort at 13.5 CPR. Ongoing cohort-level monitoring considers any difference less than 2.0 CPR (calculated using 3-month speeds) to be acceptable.
Looking ahead
Prepayment speeds should increase another 25% in May—lagged mortgage rates fall 11 bp on a 30-day lag, there is one additional business day, and seasonal turnover increases as school years end across much of the country. June will likely slow a little since there are two fewer business days. Speeds should rebound in July and August due to higher day count and peak housing turnover.
Data Tables
Exhibit 2: Prepayment Summary
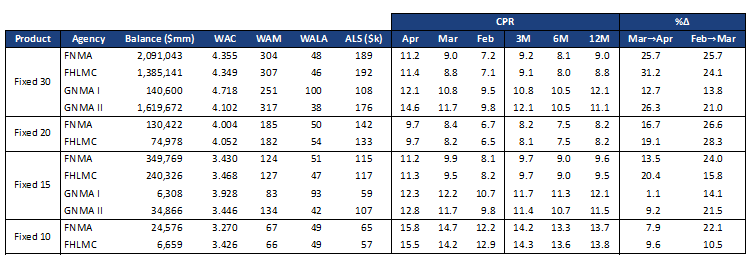
Source: Fannie Mae, Freddie Mac, Ginnie Mae, eMBS, Amherst Pierpont Securities
Our short term forecast is shown in Exhibit 5 (Fannie Mae) and Exhibit 6 (Freddie Mac). Exhibit 4 shows the static rates used in the prepayment forecast.
Exhibit 3: Agency Speeds, Largest Cohorts
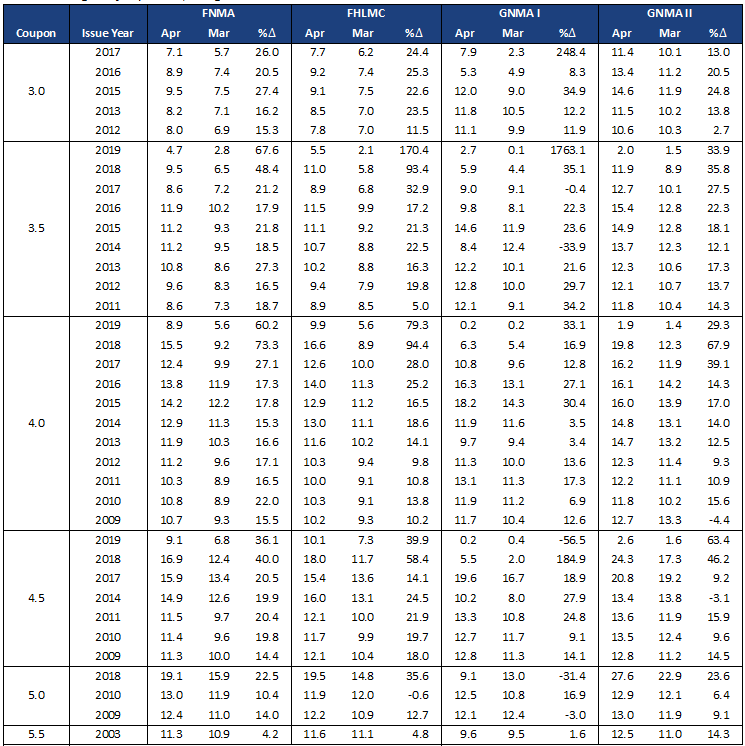
Source: Fannie Mae, Freddie Mac, Ginnie Mae, eMBS, 1010data, Amherst Pierpont Securities
Exhibit 4: Mortgage Rate Forecast
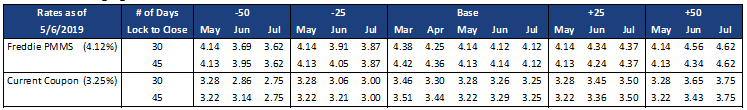
Source: Freddie Mac, Bloomberg, Amherst Pierpont Securities
Exhibit 5: Fannie Mae Short Term Forecast
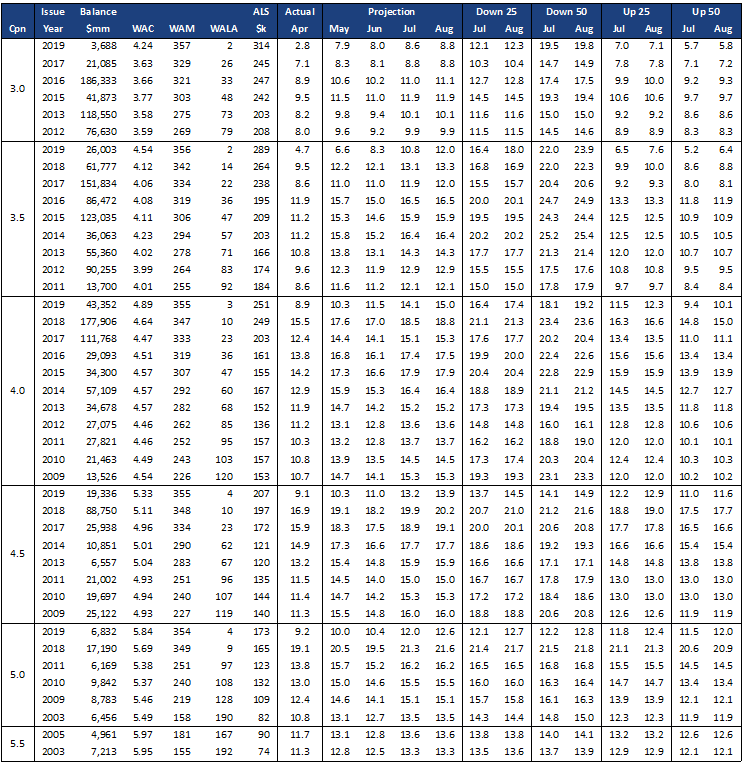
Source: Fannie Mae, eMBS, 1010data, Amherst Pierpont Securities
Exhibit 6: Freddie Mac Short Term Forecast
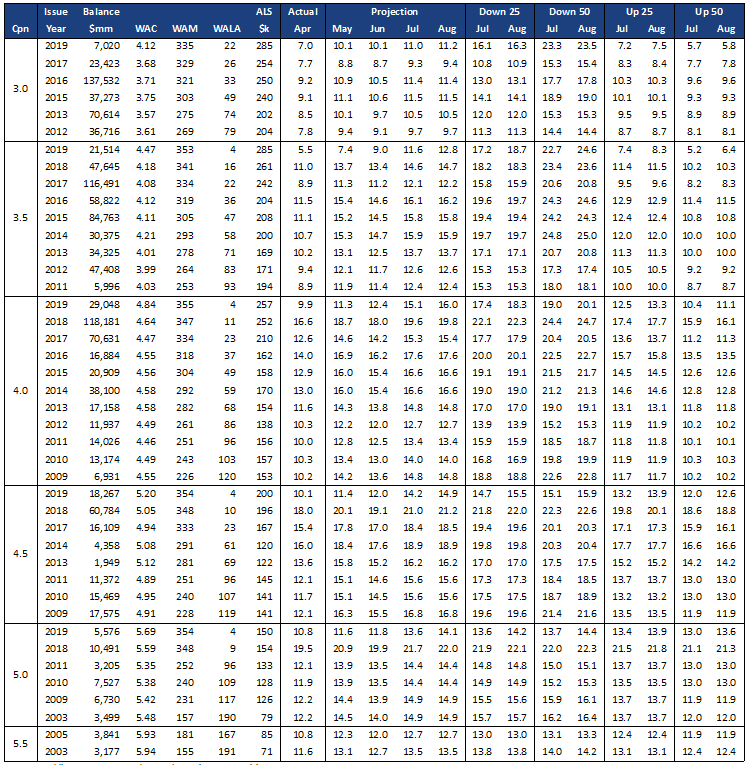
Source: Freddie Mac, eMBS, 1010data, Amherst Pierpont Securities
This material is intended only for institutional investors and does not carry all of the independence and disclosure standards of retail debt research reports. In the preparation of this material, the author may have consulted or otherwise discussed the matters referenced herein with one or more of SCM’s trading desks, any of which may have accumulated or otherwise taken a position, long or short, in any of the financial instruments discussed in or related to this material. Further, SCM may act as a market maker or principal dealer and may have proprietary interests that differ or conflict with the recipient hereof, in connection with any financial instrument discussed in or related to this material.
This message, including any attachments or links contained herein, is subject to important disclaimers, conditions, and disclosures regarding Electronic Communications, which you can find at https://portfolio-strategy.apsec.com/sancap-disclaimers-and-disclosures.
Important Disclaimers
Copyright © 2026 Santander US Capital Markets LLC and its affiliates (“SCM”). All rights reserved. SCM is a member of FINRA and SIPC. This material is intended for limited distribution to institutions only and is not publicly available. Any unauthorized use or disclosure is prohibited.
In making this material available, SCM (i) is not providing any advice to the recipient, including, without limitation, any advice as to investment, legal, accounting, tax and financial matters, (ii) is not acting as an advisor or fiduciary in respect of the recipient, (iii) is not making any predictions or projections and (iv) intends that any recipient to which SCM has provided this material is an “institutional investor” (as defined under applicable law and regulation, including FINRA Rule 4512 and that this material will not be disseminated, in whole or part, to any third party by the recipient.
The author of this material is an economist, desk strategist or trader. In the preparation of this material, the author may have consulted or otherwise discussed the matters referenced herein with one or more of SCM’s trading desks, any of which may have accumulated or otherwise taken a position, long or short, in any of the financial instruments discussed in or related to this material. Further, SCM or any of its affiliates may act as a market maker or principal dealer and may have proprietary interests that differ or conflict with the recipient hereof, in connection with any financial instrument discussed in or related to this material.
This material (i) has been prepared for information purposes only and does not constitute a solicitation or an offer to buy or sell any securities, related investments or other financial instruments, (ii) is neither research, a “research report” as commonly understood under the securities laws and regulations promulgated thereunder nor the product of a research department, (iii) or parts thereof may have been obtained from various sources, the reliability of which has not been verified and cannot be guaranteed by SCM, (iv) should not be reproduced or disclosed to any other person, without SCM’s prior consent and (v) is not intended for distribution in any jurisdiction in which its distribution would be prohibited.
In connection with this material, SCM (i) makes no representation or warranties as to the appropriateness or reliance for use in any transaction or as to the permissibility or legality of any financial instrument in any jurisdiction, (ii) believes the information in this material to be reliable, has not independently verified such information and makes no representation, express or implied, with regard to the accuracy or completeness of such information, (iii) accepts no responsibility or liability as to any reliance placed, or investment decision made, on the basis of such information by the recipient and (iv) does not undertake, and disclaims any duty to undertake, to update or to revise the information contained in this material.
Unless otherwise stated, the views, opinions, forecasts, valuations, or estimates contained in this material are those solely of the author, as of the date of publication of this material, and are subject to change without notice. The recipient of this material should make an independent evaluation of this information and make such other investigations as the recipient considers necessary (including obtaining independent financial advice), before transacting in any financial market or instrument discussed in or related to this material.
Important disclaimers for clients in the EU and UK
This publication has been prepared by Trading Desk Strategists within the Sales and Trading functions of Santander US Capital Markets LLC (“SanCap”), the US registered broker-dealer of Santander Corporate & Investment Banking. This communication is distributed in the EEA by Banco Santander S.A., a credit institution registered in Spain and authorised and regulated by the Bank of Spain and the CNMV. Any EEA recipient of this communication that would like to affect any transaction in any security or issuer discussed herein should do so with Banco Santander S.A. or any of its affiliates (together “Santander”). This communication has been distributed in the UK by Banco Santander, S.A.’s London branch, authorised by the Bank of Spain and subject to regulatory oversight on certain matters by the Financial Conduct Authority (FCA) and the Prudential Regulation Authority (PRA).
The publication is intended for exclusive use for Professional Clients and Eligible Counterparties as defined by MiFID II and is not intended for use by retail customers or for any persons or entities in any jurisdictions or country where such distribution or use would be contrary to local law or regulation.
This material is not a product of Santander´s Research Team and does not constitute independent investment research. This is a marketing communication and may contain ¨investment recommendations¨ as defined by the Market Abuse Regulation 596/2014 ("MAR"). This publication has not been prepared in accordance with legal requirements designed to promote the independence of research and is not subject to any prohibition on dealing ahead of the dissemination of investment research. The author, date and time of the production of this publication are as indicated herein.
This publication does not constitute investment advice and may not be relied upon to form an investment decision, nor should it be construed as any offer to sell or issue or invitation to purchase, acquire or subscribe for any instruments referred herein. The publication has been prepared in good faith and based on information Santander considers reliable as of the date of publication, but Santander does not guarantee or represent, express or implied, that such information is accurate or complete. All estimates, forecasts and opinions are current as at the date of this publication and are subject to change without notice. Unless otherwise indicated, Santander does not intend to update this publication. The views and commentary in this publication may not be objective or independent of the interests of the Trading and Sales functions of Santander, who may be active participants in the markets, investments or strategies referred to herein and/or may receive compensation from investment banking and non-investment banking services from entities mentioned herein. Santander may trade as principal, make a market or hold positions in instruments (or related derivatives) and/or hold financial interest in entities discussed herein. Santander may provide market commentary or trading strategies to other clients or engage in transactions which may differ from views expressed herein. Santander may have acted upon the contents of this publication prior to you having received it.
This publication is intended for the exclusive use of the recipient and must not be reproduced, redistributed or transmitted, in whole or in part, without Santander’s consent. The recipient agrees to keep confidential at all times information contained herein.


