Uncategorized
MBS: Relative value shifts in prime jumbo private MBS
admin | May 3, 2019
This material is a Marketing Communication and does not constitute Independent Investment Research.
A drop in prime jumbo private MBS supply of nearly a third this year has driven spreads much tighter in ‘AAA’ front sequentials and pass-throughs to the point of looking rich to agency MBS. But for relative value investors, last cash flow sequentials have lagged the tightening and still offer attractive spread.
Spreads on prime jumbo super-senior pass-throughs have tightened sharply this year. The JPMMT shelf that in January priced pass-throughs $2-00 back of TBA, for instance, in April priced just $1-08 back of the FNCL 4.0% benchmark. The move marks the tightest nominal print for private 4.0% super-senior pass-throughs since the beginning of last year. It is also worth noting that when the April deal priced, agency jumbo pass-throughs traded just $1-04 back of TBA, leaving the priced difference between private and agency jumbo pass-throughs at only $0-04. The price basis between 4.0% private pass-throughs and agency jumbo pools has averaged roughly $0-24 over the past year and was as wide as $0-18 as recently as late March. (Exhibit 1)
Exhibit 1: Jumbo pass-throughs tighten to agency TBA and jumbo pools
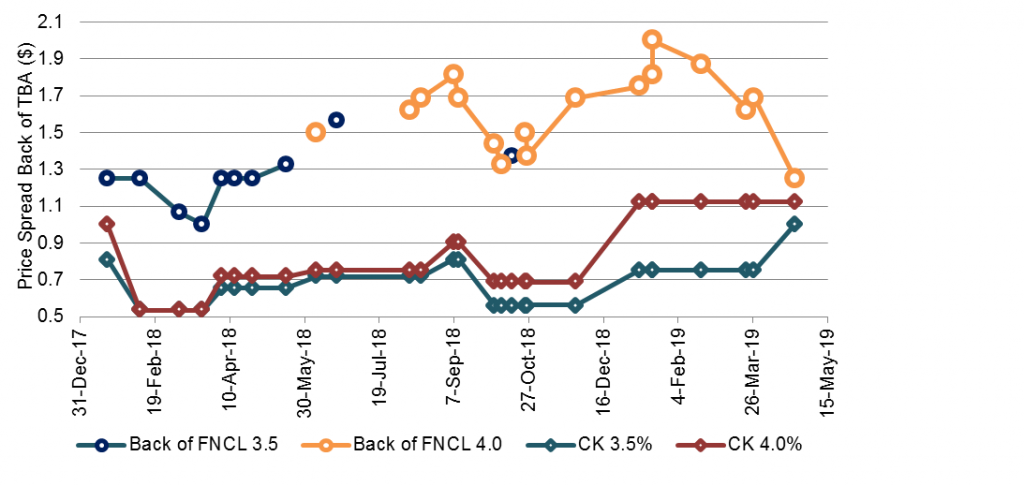
Source: Bloomberg LP, APS
Spread tightening has not been contained to pass-throughs. Super-senor front sequentials have seen pronounced spread tightening as well. Front sequentials are by and large quoted on a spread behind the price of their comparable coupon Fannie Mae 15-year pass-through. Front sequentials with 4.0% coupons traded as wide as $2-00 back of 15-year TBA and have tightened by $0-20, with the most recent new issue deal pricing $1-12 back of TBA (Exhibit 2)
Exhibit 2: Front sequentials tighten as the benchmark widens
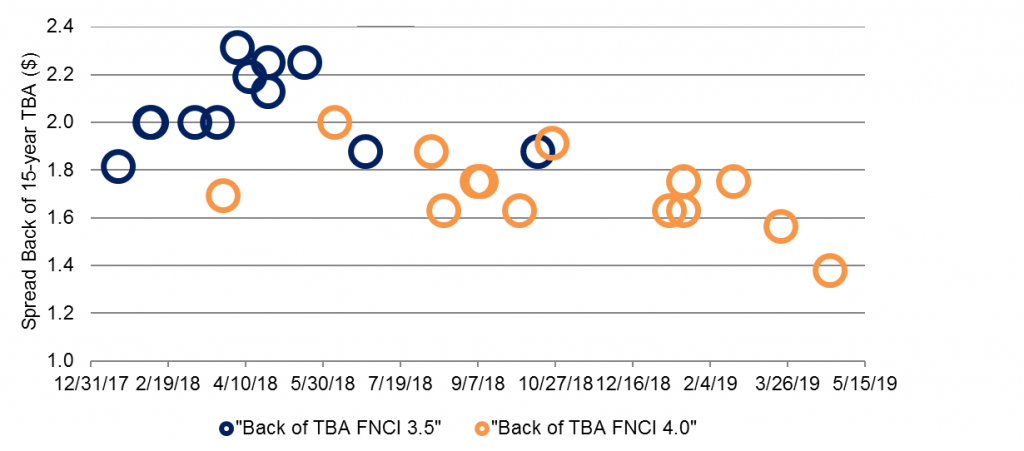
Source: Bloomberg LP, APS
One part of the cash flow structure that widened substantially into the end of last year and has remained wide is the last cash flow sequential. Those bonds traded to a spread of 100 bp over interpolated swaps this time last year, widened by 40 bps into the end of the year and have continued to trade in that context throughout this year. A relatively weak bid for duration is not unique to the private MBS market as last cash flow sequential CMOs have widened by roughly 15 bp since the end of the year and have remained at the wides, with spreads in the context of 105 over the interpolated Treasury curve. Private LCFs have widened significantly more than their agency counterparts, suggesting that they are not only the relatively inexpensive cash flow within the confines of private MBS but relative to agency CMOs, too. (Exhibit 3)
Exhibit 3: Private last cash flow sequentials offer significant relative value
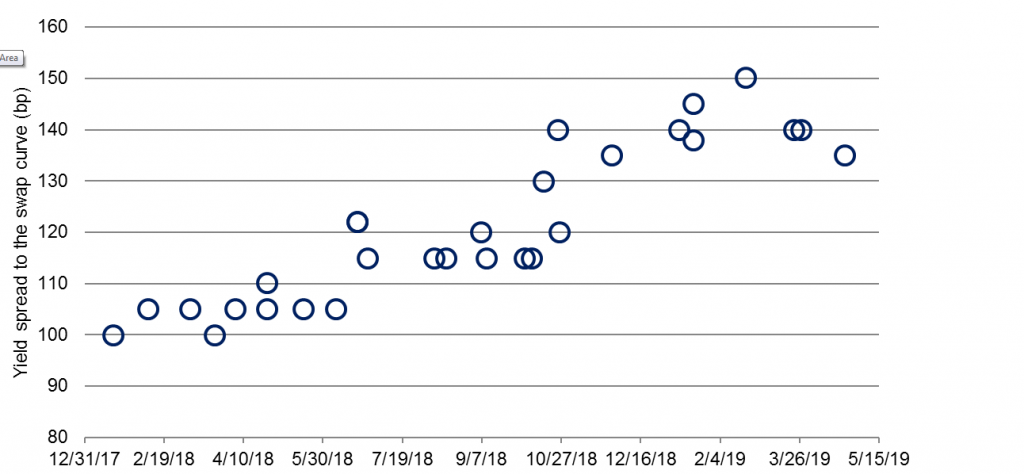
Source: Bloomberg LP, APS
Private prime jumbo supply and spreads likely to remain tight
Prime jumbo issuance in the first quarter of 2019 dipped to just $6.25 billion, comprising 30% of overall PLS issuance. This is a fairly significant drop from the first quarter of 2018 where prime jumbo volumes approached $10 billion and comprised 40% of total issuance. There are likely a number of factors that may be pushing issuance volumes lower. Banks have increased whole loan holdings by $50 billion over the past 12 months. It’s highly likely that a significant portion of those holdings are either conforming or non-conforming jumbo loans that could have otherwise been sold to the GSEs or gone to private execution. A slowdown in home price appreciation in high cost areas and recent changes to the tax code capping mortgage interest and property tax deductions have stifled demand for high balance loans.
The absolute level of conforming jumbo issuance from the GSEs is also down year over year. Through the first four months of last year, the GSEs pooled roughly $4 billion of conforming jumbo loans representing 1.6% of total originations. That number fell to $2.5 billion through the first four months of 2019 representing 1.2% of overall volumes. Holding the percentage of overall production constant year over year would suggest that conforming jumbo production should have been closer to $3.5 billion. It’s likely that the decreased share of overall production may have flowed into PLS. Even if all those loans flowed into non-agency deals, it would have only contributed an additional $1 billion and even with that, first quarter PLS production was off by a third year over year. Supply constraints should keep a lid on spreads. Given the historically tight relationship between pass-throughs and conforming jumbo pools, it seems unlikely that spreads on pass-throughs could rally materially absent a significant rally in spreads on conforming jumbo pools. Given the overall widening in the benchmark, front sequential spreads may have some room to tighten while last cash flow sequentials appear to offer significant relative when compared to PLS pass-throughs and front sequentials as well as comparable agency last cash flows.
This material is intended only for institutional investors and does not carry all of the independence and disclosure standards of retail debt research reports. In the preparation of this material, the author may have consulted or otherwise discussed the matters referenced herein with one or more of SCM’s trading desks, any of which may have accumulated or otherwise taken a position, long or short, in any of the financial instruments discussed in or related to this material. Further, SCM may act as a market maker or principal dealer and may have proprietary interests that differ or conflict with the recipient hereof, in connection with any financial instrument discussed in or related to this material.
This message, including any attachments or links contained herein, is subject to important disclaimers, conditions, and disclosures regarding Electronic Communications, which you can find at https://portfolio-strategy.apsec.com/sancap-disclaimers-and-disclosures.
Important Disclaimers
Copyright © 2026 Santander US Capital Markets LLC and its affiliates (“SCM”). All rights reserved. SCM is a member of FINRA and SIPC. This material is intended for limited distribution to institutions only and is not publicly available. Any unauthorized use or disclosure is prohibited.
In making this material available, SCM (i) is not providing any advice to the recipient, including, without limitation, any advice as to investment, legal, accounting, tax and financial matters, (ii) is not acting as an advisor or fiduciary in respect of the recipient, (iii) is not making any predictions or projections and (iv) intends that any recipient to which SCM has provided this material is an “institutional investor” (as defined under applicable law and regulation, including FINRA Rule 4512 and that this material will not be disseminated, in whole or part, to any third party by the recipient.
The author of this material is an economist, desk strategist or trader. In the preparation of this material, the author may have consulted or otherwise discussed the matters referenced herein with one or more of SCM’s trading desks, any of which may have accumulated or otherwise taken a position, long or short, in any of the financial instruments discussed in or related to this material. Further, SCM or any of its affiliates may act as a market maker or principal dealer and may have proprietary interests that differ or conflict with the recipient hereof, in connection with any financial instrument discussed in or related to this material.
This material (i) has been prepared for information purposes only and does not constitute a solicitation or an offer to buy or sell any securities, related investments or other financial instruments, (ii) is neither research, a “research report” as commonly understood under the securities laws and regulations promulgated thereunder nor the product of a research department, (iii) or parts thereof may have been obtained from various sources, the reliability of which has not been verified and cannot be guaranteed by SCM, (iv) should not be reproduced or disclosed to any other person, without SCM’s prior consent and (v) is not intended for distribution in any jurisdiction in which its distribution would be prohibited.
In connection with this material, SCM (i) makes no representation or warranties as to the appropriateness or reliance for use in any transaction or as to the permissibility or legality of any financial instrument in any jurisdiction, (ii) believes the information in this material to be reliable, has not independently verified such information and makes no representation, express or implied, with regard to the accuracy or completeness of such information, (iii) accepts no responsibility or liability as to any reliance placed, or investment decision made, on the basis of such information by the recipient and (iv) does not undertake, and disclaims any duty to undertake, to update or to revise the information contained in this material.
Unless otherwise stated, the views, opinions, forecasts, valuations, or estimates contained in this material are those solely of the author, as of the date of publication of this material, and are subject to change without notice. The recipient of this material should make an independent evaluation of this information and make such other investigations as the recipient considers necessary (including obtaining independent financial advice), before transacting in any financial market or instrument discussed in or related to this material.
Important disclaimers for clients in the EU and UK
This publication has been prepared by Trading Desk Strategists within the Sales and Trading functions of Santander US Capital Markets LLC (“SanCap”), the US registered broker-dealer of Santander Corporate & Investment Banking. This communication is distributed in the EEA by Banco Santander S.A., a credit institution registered in Spain and authorised and regulated by the Bank of Spain and the CNMV. Any EEA recipient of this communication that would like to affect any transaction in any security or issuer discussed herein should do so with Banco Santander S.A. or any of its affiliates (together “Santander”). This communication has been distributed in the UK by Banco Santander, S.A.’s London branch, authorised by the Bank of Spain and subject to regulatory oversight on certain matters by the Financial Conduct Authority (FCA) and the Prudential Regulation Authority (PRA).
The publication is intended for exclusive use for Professional Clients and Eligible Counterparties as defined by MiFID II and is not intended for use by retail customers or for any persons or entities in any jurisdictions or country where such distribution or use would be contrary to local law or regulation.
This material is not a product of Santander´s Research Team and does not constitute independent investment research. This is a marketing communication and may contain ¨investment recommendations¨ as defined by the Market Abuse Regulation 596/2014 ("MAR"). This publication has not been prepared in accordance with legal requirements designed to promote the independence of research and is not subject to any prohibition on dealing ahead of the dissemination of investment research. The author, date and time of the production of this publication are as indicated herein.
This publication does not constitute investment advice and may not be relied upon to form an investment decision, nor should it be construed as any offer to sell or issue or invitation to purchase, acquire or subscribe for any instruments referred herein. The publication has been prepared in good faith and based on information Santander considers reliable as of the date of publication, but Santander does not guarantee or represent, express or implied, that such information is accurate or complete. All estimates, forecasts and opinions are current as at the date of this publication and are subject to change without notice. Unless otherwise indicated, Santander does not intend to update this publication. The views and commentary in this publication may not be objective or independent of the interests of the Trading and Sales functions of Santander, who may be active participants in the markets, investments or strategies referred to herein and/or may receive compensation from investment banking and non-investment banking services from entities mentioned herein. Santander may trade as principal, make a market or hold positions in instruments (or related derivatives) and/or hold financial interest in entities discussed herein. Santander may provide market commentary or trading strategies to other clients or engage in transactions which may differ from views expressed herein. Santander may have acted upon the contents of this publication prior to you having received it.
This publication is intended for the exclusive use of the recipient and must not be reproduced, redistributed or transmitted, in whole or in part, without Santander’s consent. The recipient agrees to keep confidential at all times information contained herein.


